
Marketo Revenue Cycle Analytics Reporting: Funnel Analysis and KPI Setup Guide
Marketing Automation, Marketo
8 September 2026
- What business questions should Revenue Cycle Analytics answer?
- How do you build a reportable revenue model?
- What data must be in place before reporting?
- How do you set core reports and funnel KPIs?
- Scenario: why can a high ROI fail to be reproducible?
- Go-live checklist
- Frequently asked questions
- Conclusion
- Further reading
- What business questions should Revenue Cycle Analytics answer?
- How do you build a reportable revenue model?
- What data must be in place before reporting?
- How do you set core reports and funnel KPIs?
- Scenario: why can a high ROI fail to be reproducible?
- Go-live checklist
- Frequently asked questions
- Conclusion
- Further reading
Marketing teams can report opens, clicks, and lead volume, but often struggle to show which programs accelerate opportunities, create pipeline, or influence revenue. Marketo Revenue Cycle Analytics connects people progression, stage velocity, program costs, and opportunities, but reports are only as reliable as their underlying definitions. LeadsTech’s practical approach is to align management decisions, revenue-stage definitions, and data ownership first, then build reports that support action rather than simply display numbers.
Key takeaways
Define one shared revenue model and clear entry and exit criteria for every stage before building reports. Review Balance, In Flow, Out Flow, Conversion Rate, and Average Time together instead of looking only at end-of-period volume. Validate program costs, success statuses, CRM opportunities, and attribution rules first, or Revenue to Investment can be misread.
1. What business questions should Revenue Cycle Analytics answer?
A good report starts with decisions, not fields. Which stage has the greatest accumulation? How many days does it take for an MQL to become sales accepted? Which programs acquire new names, and which move opportunities forward? Which markets or product lines produce more stable pipeline conversion?
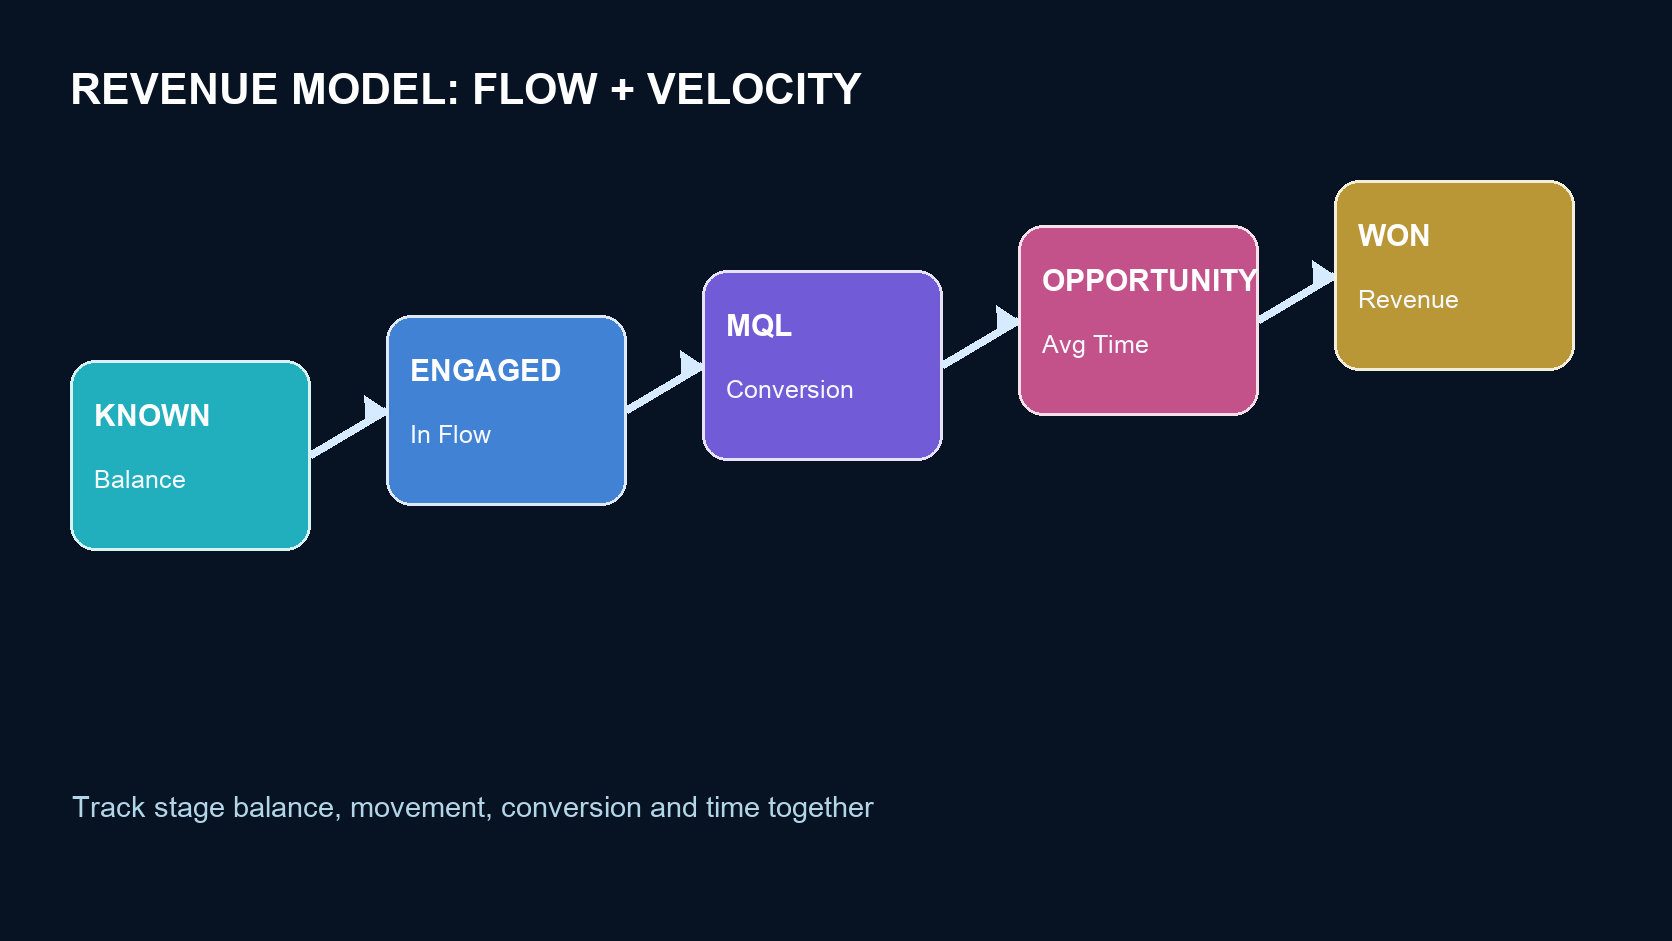
The value of a revenue model is turning these questions into measurable flow. Success Path represents the primary route from known prospect to won business; branches such as Recycled, Disqualified, and Inactive must also be recorded so the team can understand loss and recycling rather than seeing only the success path.
2. How do you build a reportable revenue model?
Align the business definition of every stage with Sales, including entry triggers, exit triggers, allowed recycling, and ownership. Prefer explicit events such as status changes, opportunity creation, or closed-won events over static filters. Validate and approve the stages before defining assignment rules for existing and new people. Do not create stages merely to make reports look better; each stage should support an actionable management decision.
3. What data must be in place before reporting?
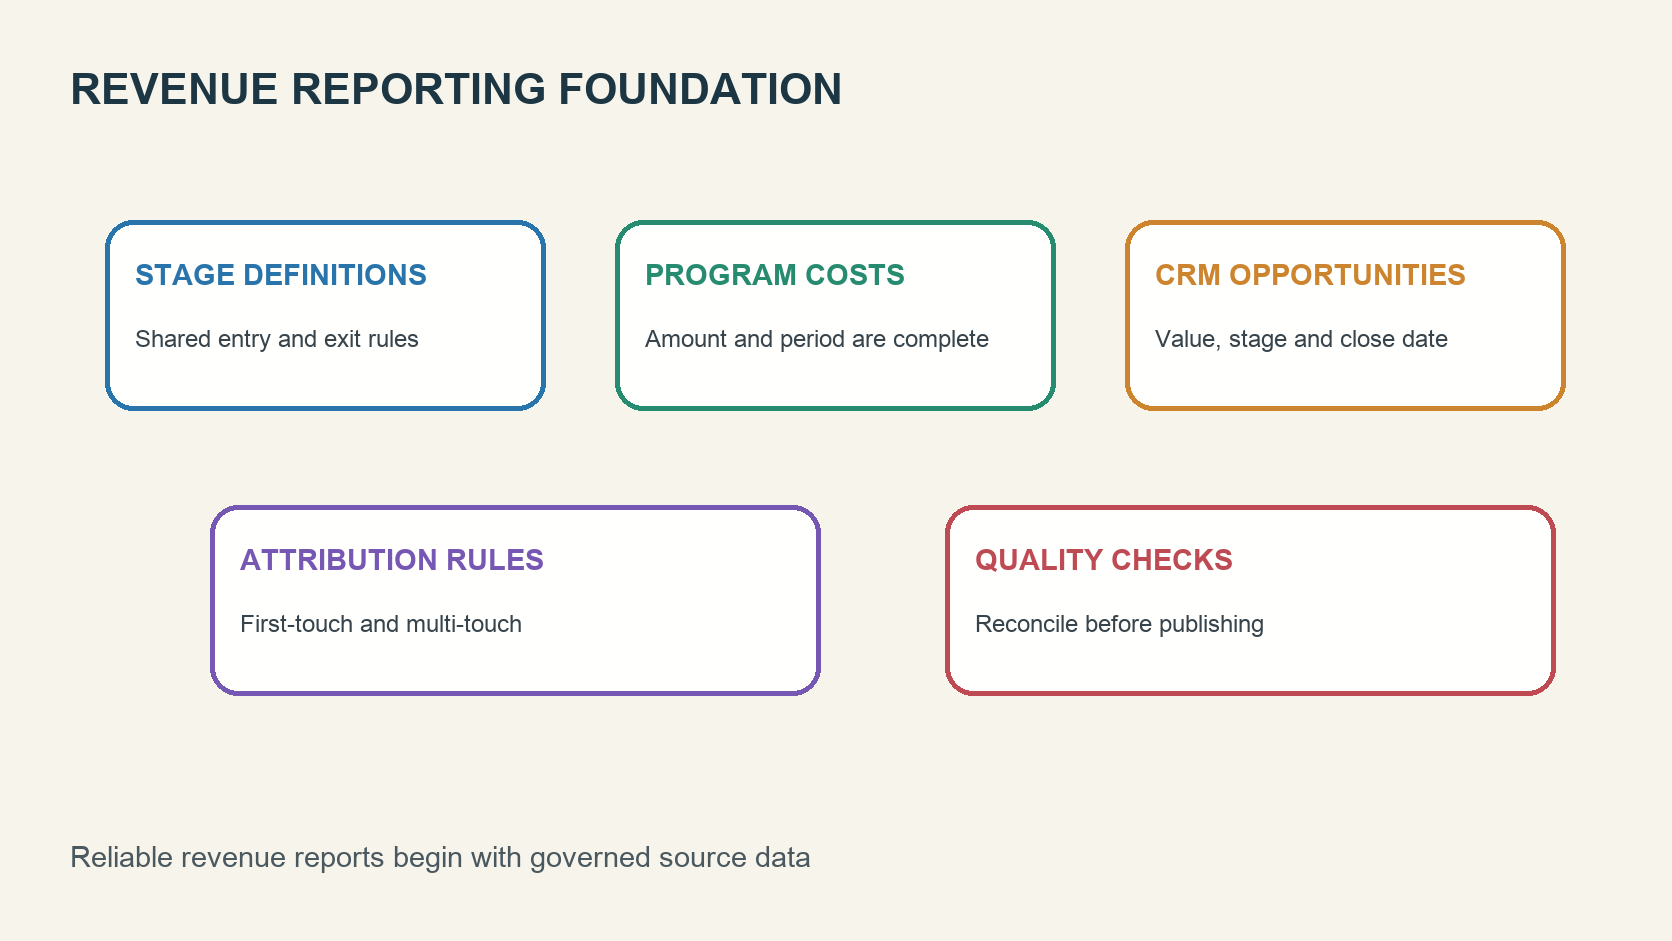
First, standardize program definitions. Channel, Program Status, and Success definitions must be consistent or success cannot be compared across teams. Second, capture Period Cost with complete amounts and periods; missing costs or incorrect Analytics Behavior settings affect Program Analyzer and investment ratios. Third, validate CRM opportunity quality, including Account, Contact Role, Amount, Stage, Probability, and Close Date. Finally, define attribution rules: First-Touch helps explain new-name acquisition, while Multi-Touch distributes influence across opportunities.
4. How do you set core reports and funnel KPIs?
Balance
End-of-period people in each stage, used to identify accumulation.
In Flow / Out Flow
Entries and exits during the period, showing growth or stagnation.
Conversion Rate
The share progressing from one stage to the next.
Average Time
Days spent in a stage, used to review SLAs and handoffs.
Pipeline / Revenue Won
Pipeline and closed-won value, reconciled regularly with CRM.
Revenue to Investment
The ratio of attributed revenue to program cost, interpreted with model assumptions.
Reports should show monthly or quarterly trends and allow drill-down by market, product, channel, and program. Add data-completeness indicators such as missing costs, missing contact roles, or opportunities that cannot be linked.
5. Scenario: why can a high ROI fail to be reproducible?
Suppose a B2B company sees a webinar with a much higher Revenue to Investment ratio than other programs and increases its budget. It later discovers that the program recorded media spend but excluded production and partner costs; several programs influencing the opportunity also received attribution credit. Align the cost scope first, review new names, stage progression, pipeline, closed-won value, and revenue timing together, and observe at least one complete sales cycle before scaling investment.
6. Go-live checklist
- Revenue stages and sales statuses have shared definitions and owners.
- Success Path, detours, and entry and exit criteria have been tested.
- Program Channel, Status, and Success definitions are consistent.
- Period Cost has complete amount, currency, and period data.
- Opportunity, Contact Role, Amount, and Close Date have been reconciled.
- Reports clearly label First-Touch, Multi-Touch, and the time range.
- Data-quality checks, anomaly handling, and monthly reconciliation are in place.
7. Frequently asked questions
Is Revenue Cycle Analytics available in every Marketo edition?
Not necessarily. Some Revenue Cycle Analytics and Revenue Explorer capabilities depend on licensing; confirm the available version before modeling.
What is Success Path Analyzer best used for?
It is useful for reviewing stage balance, inflow, outflow, conversion rate, and average time, and for comparing periods of equal length.
Why can a Program Success exist without revenue?
There may be no usable Period Cost, the program analysis behavior may be excluded, opportunity links may be incomplete, or attribution criteria may not be met.
Does Revenue to Investment equal true incremental ROI?
No. It is based on platform attribution credit and recorded costs; incremental impact requires a control, comparison, or other causal design.
How often should the revenue model be reviewed?
Review it quarterly and whenever sales processes, product lines, CRM stages, or qualification rules change.
8. Conclusion
The point of Revenue Cycle Analytics is not to produce more dashboards. It is to create a shared revenue language accepted by Marketing and Sales. Start with one primary revenue model, validate flow, velocity, and data quality across three to six core stages, and then add attribution and investment ratios.
To review revenue modeling, CRM integration, or reporting governance, use the CTAs below to explore the relevant solutions or contact us.


Related Articles

Enterprise AI MarTech Trends Analysis 2024-2029 Outlook Report
From AI content productivity tools to a core engine for revenue growth and marketing transformation
*The PDF will be sent directly to your inbox.
Email Error
Please enter a valid email address.
Thank You!
The whitepaper has been sent to your inbox. If you don’t see it, please check your spam or promotions folder.