
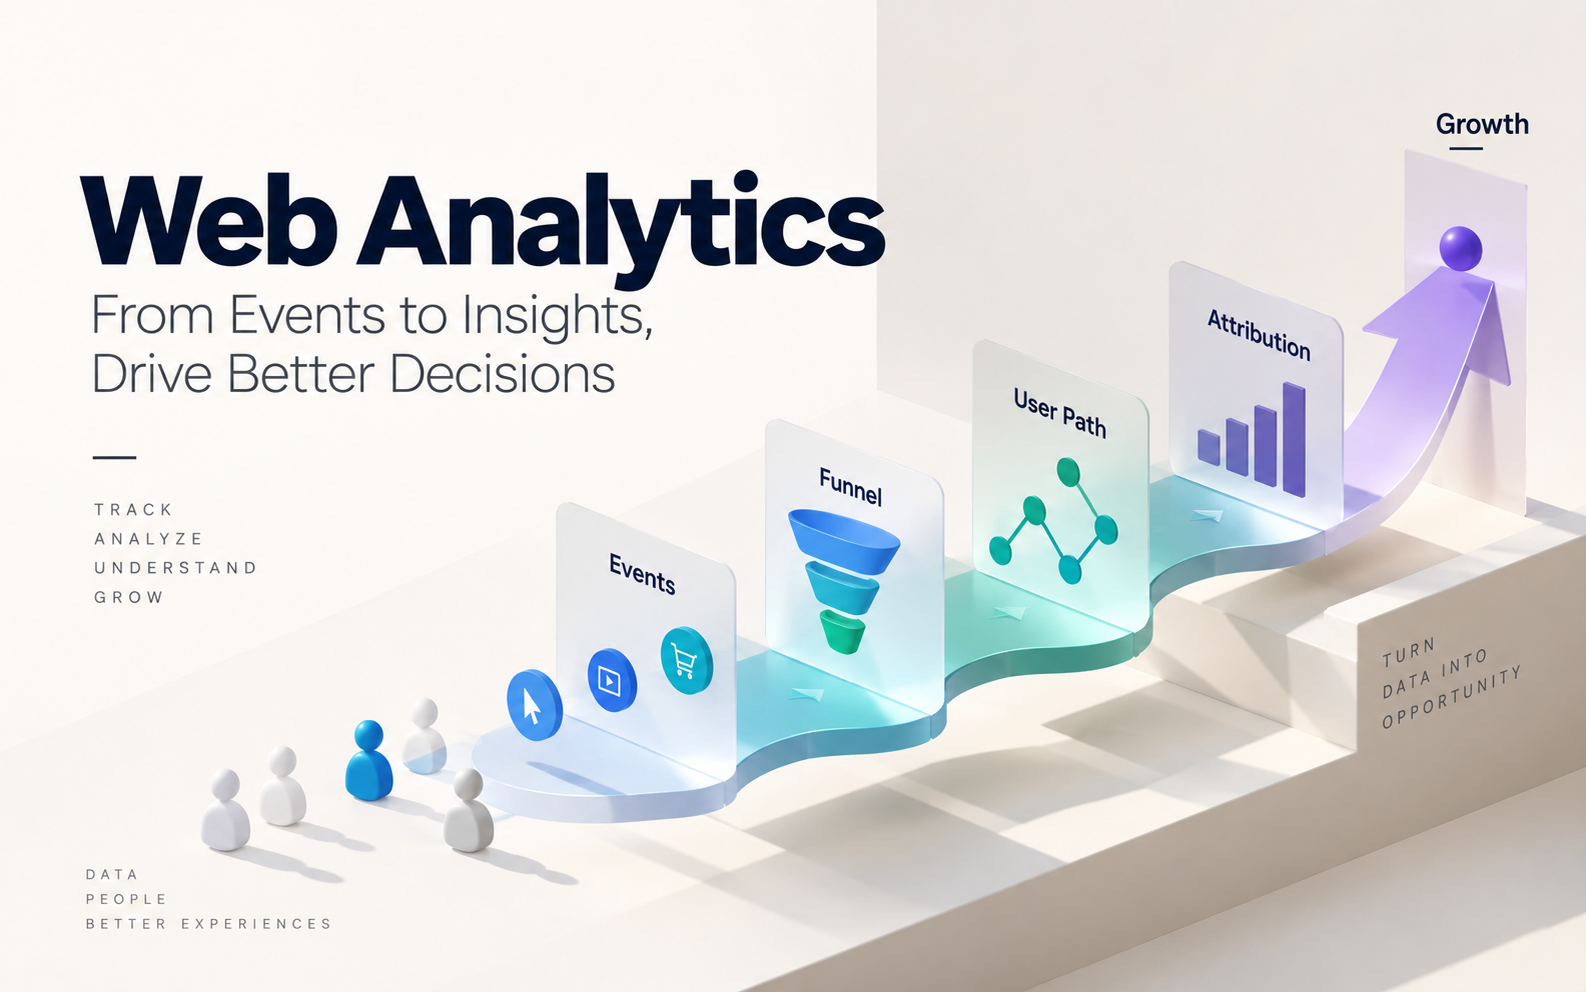
Web Analytics: Events, Funnels, Paths & Attribution
Adobe Analytics, Google Analytics, Website Analytics
26 September 2026
The real value of website analytics is not more reports. It helps businesses turn user behaviour into data they can compare and improve. Events, funnels, paths, and attribution each answer a different business question.
Summary
Effective Web Analytics should include event tracking, funnel analysis, path analysis, segmentation, attribution, and monitoring. Start by defining website goals and core journeys, then decide which interactions are worth tracking. With consistent event names, conversion rules, and data quality, teams can answer where traffic comes from, where it drops off, which content supports conversion, and which channels create value.
1. Why Can’t Website Analytics Rely on Traffic Alone?
Traffic shows how many people visit a site, but it does not show whether the site achieves its purpose. A product page may gain 40% more traffic while form submissions stay flat. The cause may be poor audience fit, a weak CTA, a long form, a poor mobile experience, or visitors who are researching without purchase intent.
Businesses need to connect traffic metrics with behaviour, conversion, and business outcomes. This is what the core functions of Web Analytics make possible.
2. Function One: Event Tracking
Event tracking records specific interactions on a website, such as CTA clicks, downloads, video plays, searches, form starts, form errors, form submissions, logins, and add-to-cart actions.
Do not track every click. Define the behaviours that matter to business objectives. Each event should include useful parameters such as page name, product category, language, campaign, form name, and source so that different contexts can be compared later.
3. Function Two: Funnel Analysis
Funnel analysis is useful for journeys with clear steps. A B2B website might follow Landing Page → Product Page → Form Start → Form Submit, while ecommerce may follow Product View → Add to Cart → Checkout → Purchase.
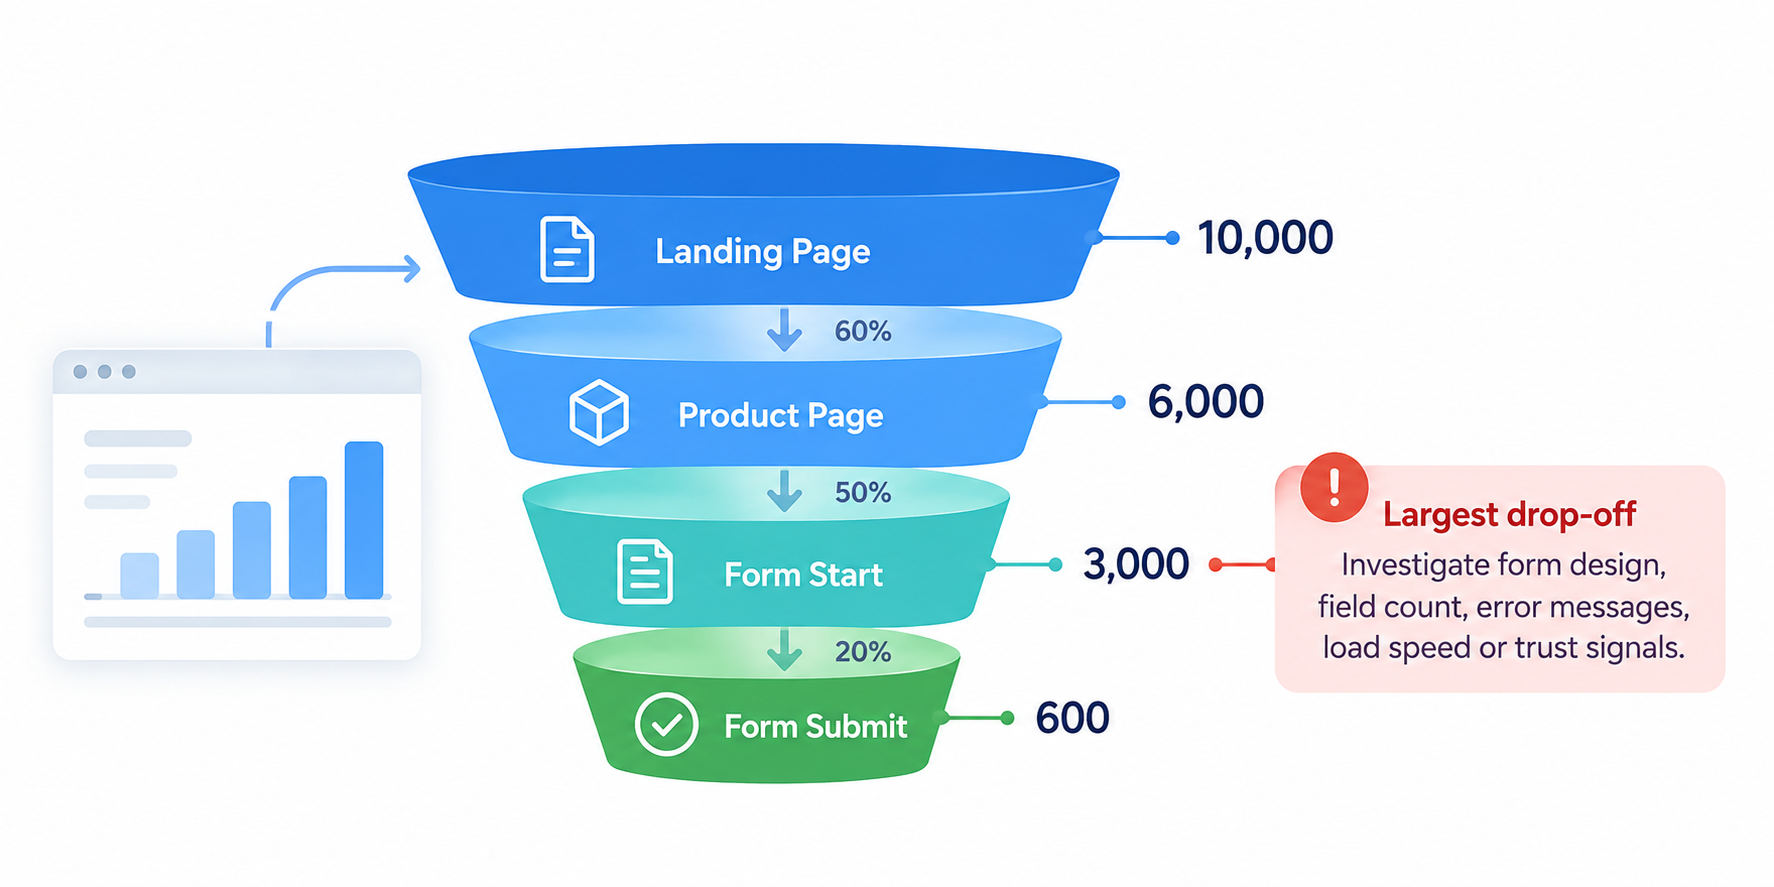
The value of a funnel is identifying where the largest drop-off occurs. If many users leave after Form Start, examine field count, error messages, page speed, or trust signals instead of only seeking more traffic.
4. Function Three: Path Analysis
Users do not always follow a predefined funnel. Path analysis shows which content they visit after an entry page, and it can also work backwards to reveal what converters viewed before converting.
This is especially useful for unexpected behaviour. Repeated visits to FAQs, site search, or pricing pages can signal missing information. If high-converting users often read case studies first, those stories may deserve more visibility.
5. Function Four: Segmentation and Comparison
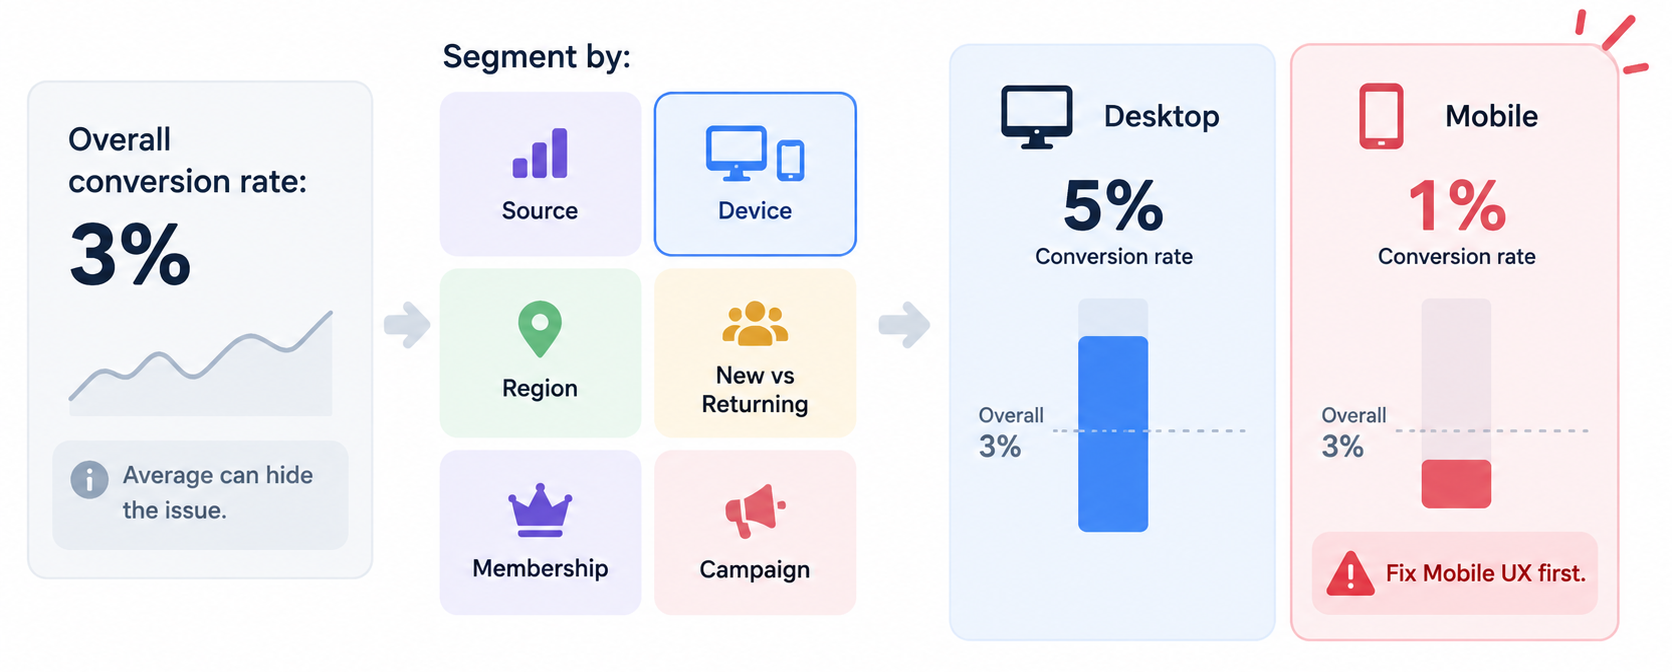
Averages often hide the real problem. Businesses should build segments by source, device, region, new or returning visitor, membership status, campaign, or product interest.
For example, an overall conversion rate of 3% may seem stable, but a closer look can show 5% on desktop and only 1% on mobile. Improving mobile UX is often more effective than simply increasing ad spend.
6. Function Five: Attribution Analysis
Attribution analysis explains how channels and touchpoints influence conversion. A user may find an article through SEO, return a week later from a LinkedIn ad, and submit a form through Direct traffic. Looking only at the last source understates the role of earlier content and media.
Select an attribution view based on the decision to be made, and do not treat one model as absolute truth. Compare First Touch, Last Touch, Data-driven, or other models alongside CRM opportunity quality to judge actual value.
7. Function Six: Dashboards and Anomaly Monitoring
A dashboard should focus on a small set of core KPIs, not place every metric on one screen. Different views can serve leadership, marketing, product, sales, and technical teams.
Set anomaly monitoring for sudden declines in form conversion, stopped event delivery, unusual campaign traffic, rising 404s, or payment-flow errors. This turns Analytics from a retrospective report into an operational monitoring tool.
8. How Can Businesses Build a Usable Analytics Framework?
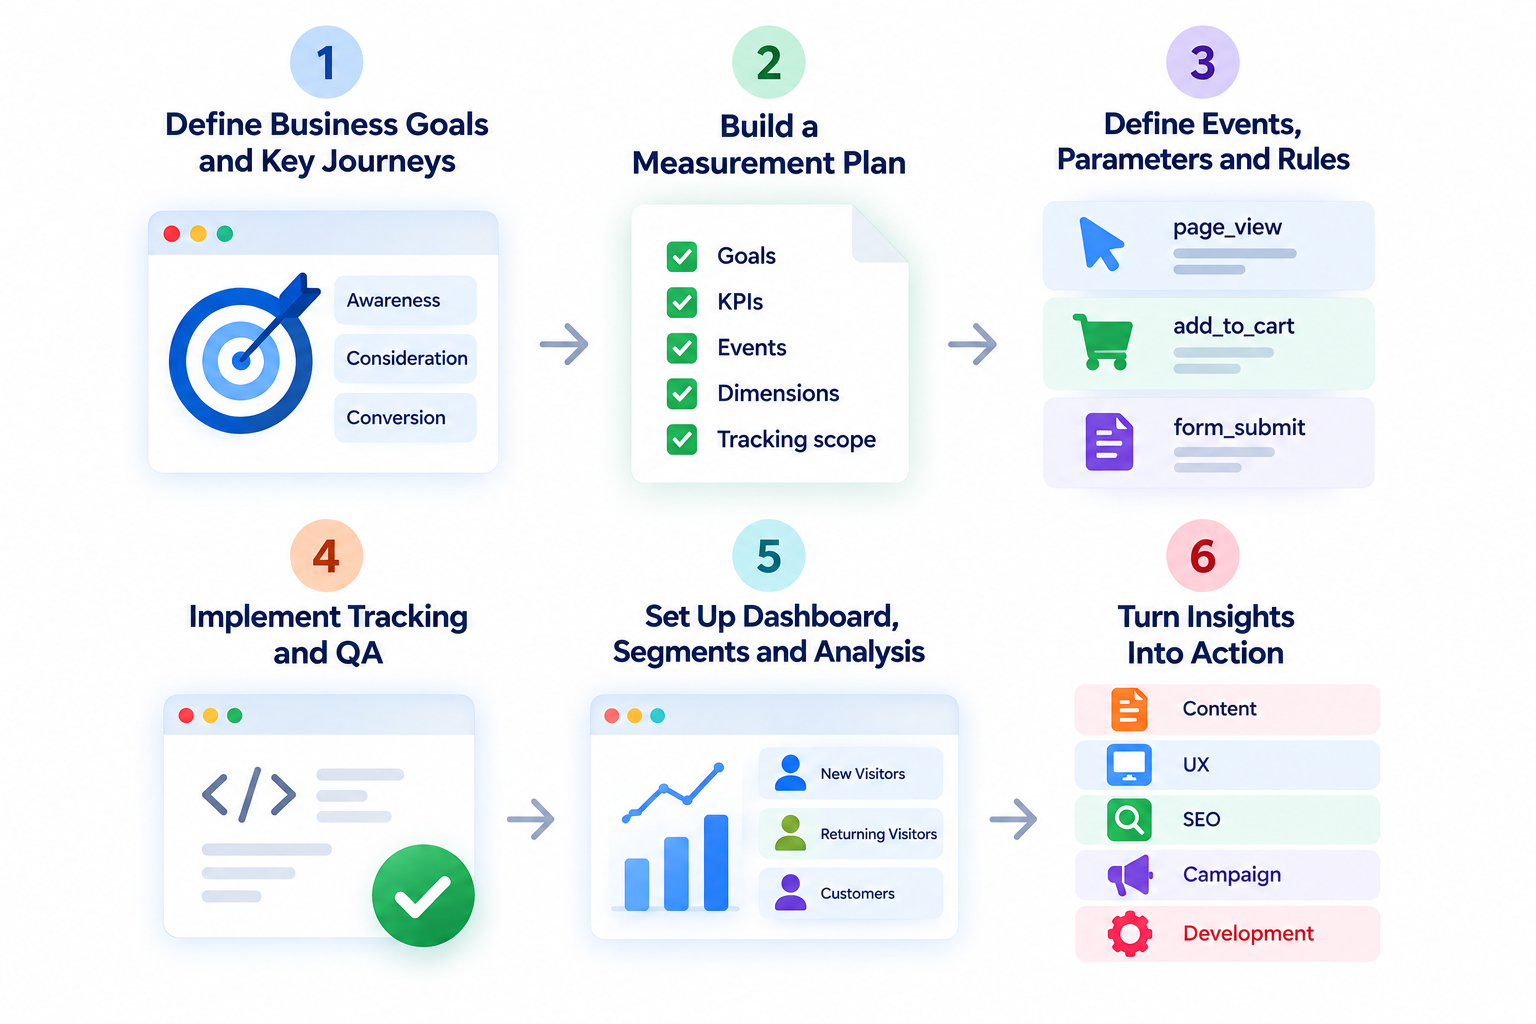
First, list website business goals and core journeys. Next, create a Measurement Plan; define events, parameters, and conversion rules; complete tracking implementation and QA; build dashboards, segments, and an analysis rhythm; then turn insights into content, UX, SEO, campaign, or development improvements.
When using GA4, Adobe Analytics, CRM, and marketing automation together, define data ownership so that the same conversion has a consistent definition across systems.
9. Frequently Asked Questions
Is more event tracking always better?
No. Too many purposeless events add maintenance cost and analytical noise. Prioritise behaviours connected to core journeys, conversion, and operational questions.
How do funnel and path analysis differ?
Funnels analyse completion and drop-off in predefined steps. Path analysis explores how users actually move through the site. Use both together.
Can attribution analysis directly determine ad budgets?
Not on its own. Consider lead quality, sales cycle, revenue, offline interactions, and data completeness as well.
10. Conclusion
The functions of Web Analytics work together. Events show what users do; funnels show where they leave; paths reveal real journeys; segments expose differences; and attribution connects channels to outcomes. With consistent tracking and governance, website data can support ongoing improvement.
Build a complete analytics and tracking framework with LeadsTech’s Analytics and digital experience services.
For help planning events, funnels, dashboards, or GA4 and Adobe Analytics implementation, contact LeadsTech.


Related Articles
Enterprise AI MarTech Trends Analysis 2024-2029 Outlook Report
From AI content productivity tools to a core engine for revenue growth and marketing transformation
*The PDF will be sent directly to your inbox.
Email Error
Please enter a valid email address.
Thank You!
The whitepaper has been sent to your inbox. If you don’t see it, please check your spam or promotions folder.