
Website Conversion Analysis: B2B Lead Funnel Diagnosis
B2B Marketing, Customer Relationship Management (CRM), Lead Generation, Website Analytics
7 August 2026
Summary
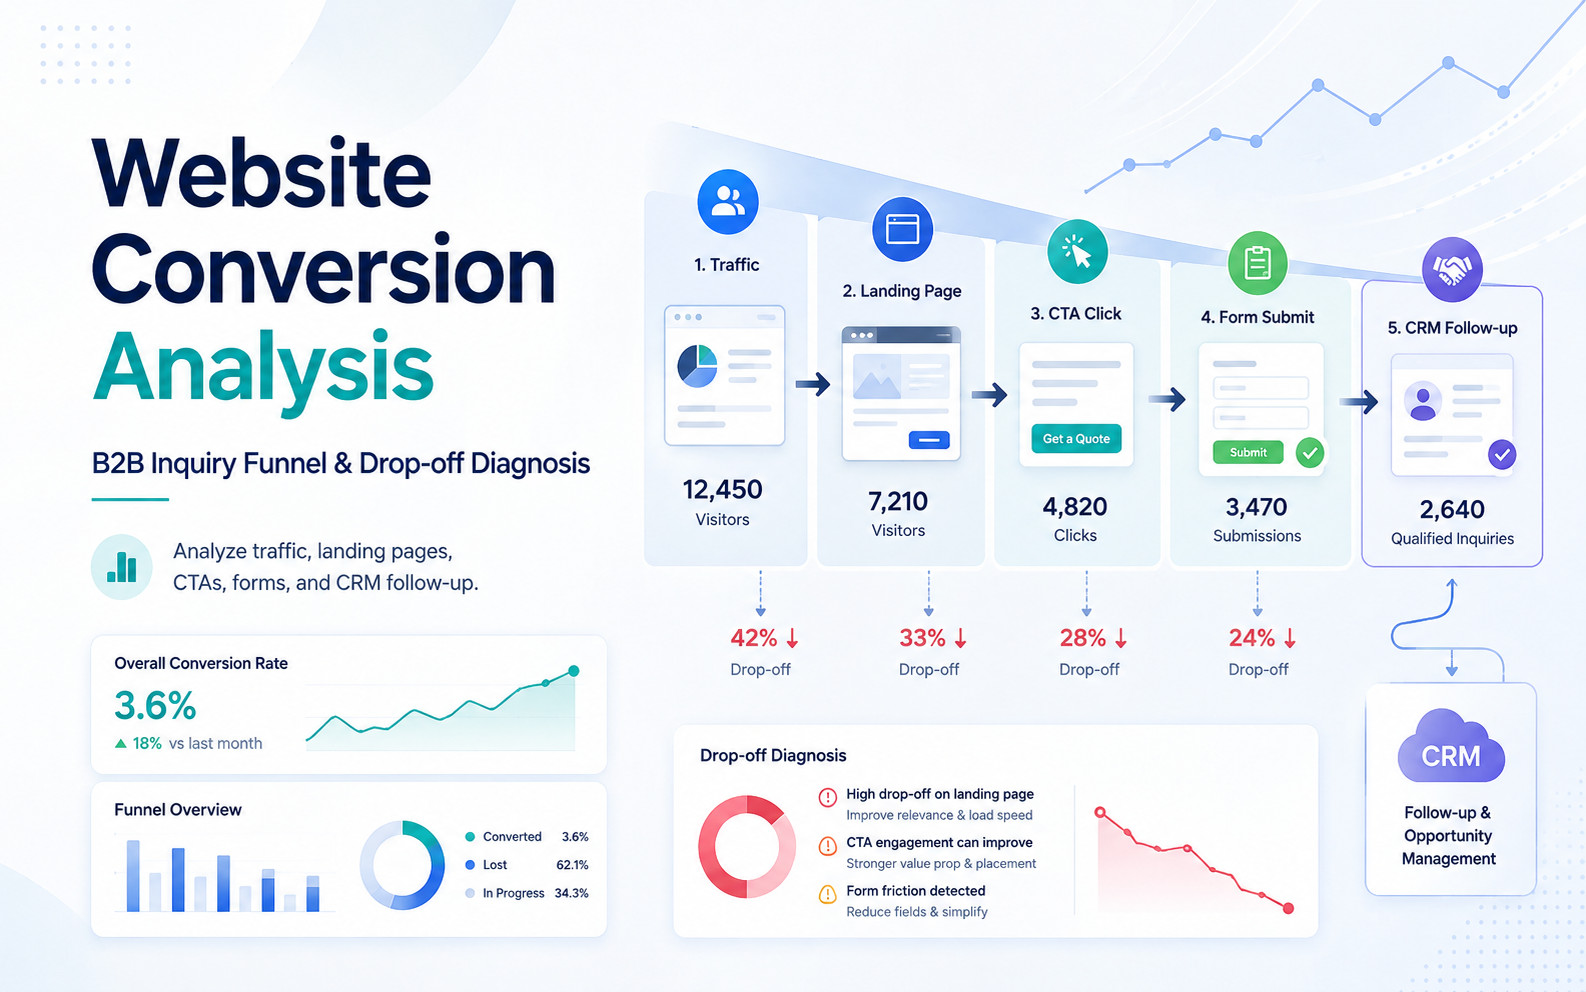
Low inquiry volume does not always mean insufficient traffic. Prospects may be dropping off on product pages, at the CTA, during form completion, or in the sales follow-up process. Website conversion rate analysis breaks the conversion journey down by traffic source, page engagement, CTA activity, form behavior, and CRM outcomes to identify exactly where users leave. This article shows how a measurable inquiry funnel replaces guesswork with data-driven diagnosis and creates a clearer closed loop between the website and CRM.
From LeadsTech’s practical experience, B2B conversion rate should not be judged by form submissions alone. Traffic quality, page engagement, CTA performance, form quality, and CRM follow-up need to be read as one inquiry journey—the starting point for effective web and customer journey analytics.
1. First, determine whether low inquiry volume is a traffic or conversion problem

When inquiries are low, many teams immediately increase advertising budgets, publish more articles, or redesign the homepage. Before making those changes, however, the first website conversion rate analysis should separate the possible causes: Are there too few target visitors? Can visitors not find the information they need? Or are leads not followed up promptly after entering the system?
Start by building a basic data chain:
- Search impressions and clicks
- Landing page visits
- Product or solution page views
- CTA clicks
- Form starts
- Form submissions
- CRM receipt confirmation
- Sales qualification or opportunity creation
This chain helps teams determine whether the problem occurs on the website or later in the export lead generation process. Each stage’s conversion rate can be calculated as “users who completed the target action at that stage ÷ users who entered the previous stage × 100%.” Use a consistent user- or session-based measurement method across all stages.
2. Drop-off 1: Website visitors are not your true target customers
A meaningful website conversion rate analysis cannot focus on total traffic alone. A site may receive 10,000 visitors per month, but inquiry volume will not grow if most arrive through irrelevant search terms, non-target countries, or low-intent content pages.
Begin with three dimensions in Search Console:
- Which search queries generate clicks;
- Which countries, devices, and search types generate visits;
- Which pages have high impressions but low click-through rates.
The Search Console Performance report shows clicks, impressions, average click-through rate, queries, pages, countries, devices, and other Google Search metrics. It is useful for understanding where organic search traffic comes from, how it performs, and whether its quality aligns with business intent.
At this stage, international conversion optimization should not chase more keywords indiscriminately. It should fill gaps in high-intent content. Product specifications, use cases, certification requirements, delivery capabilities, selection guides, and pre-quotation FAQs are usually more closely aligned with inquiry intent than generic brand introductions.
3. Drop-off 2: Visitors cannot find the information they need
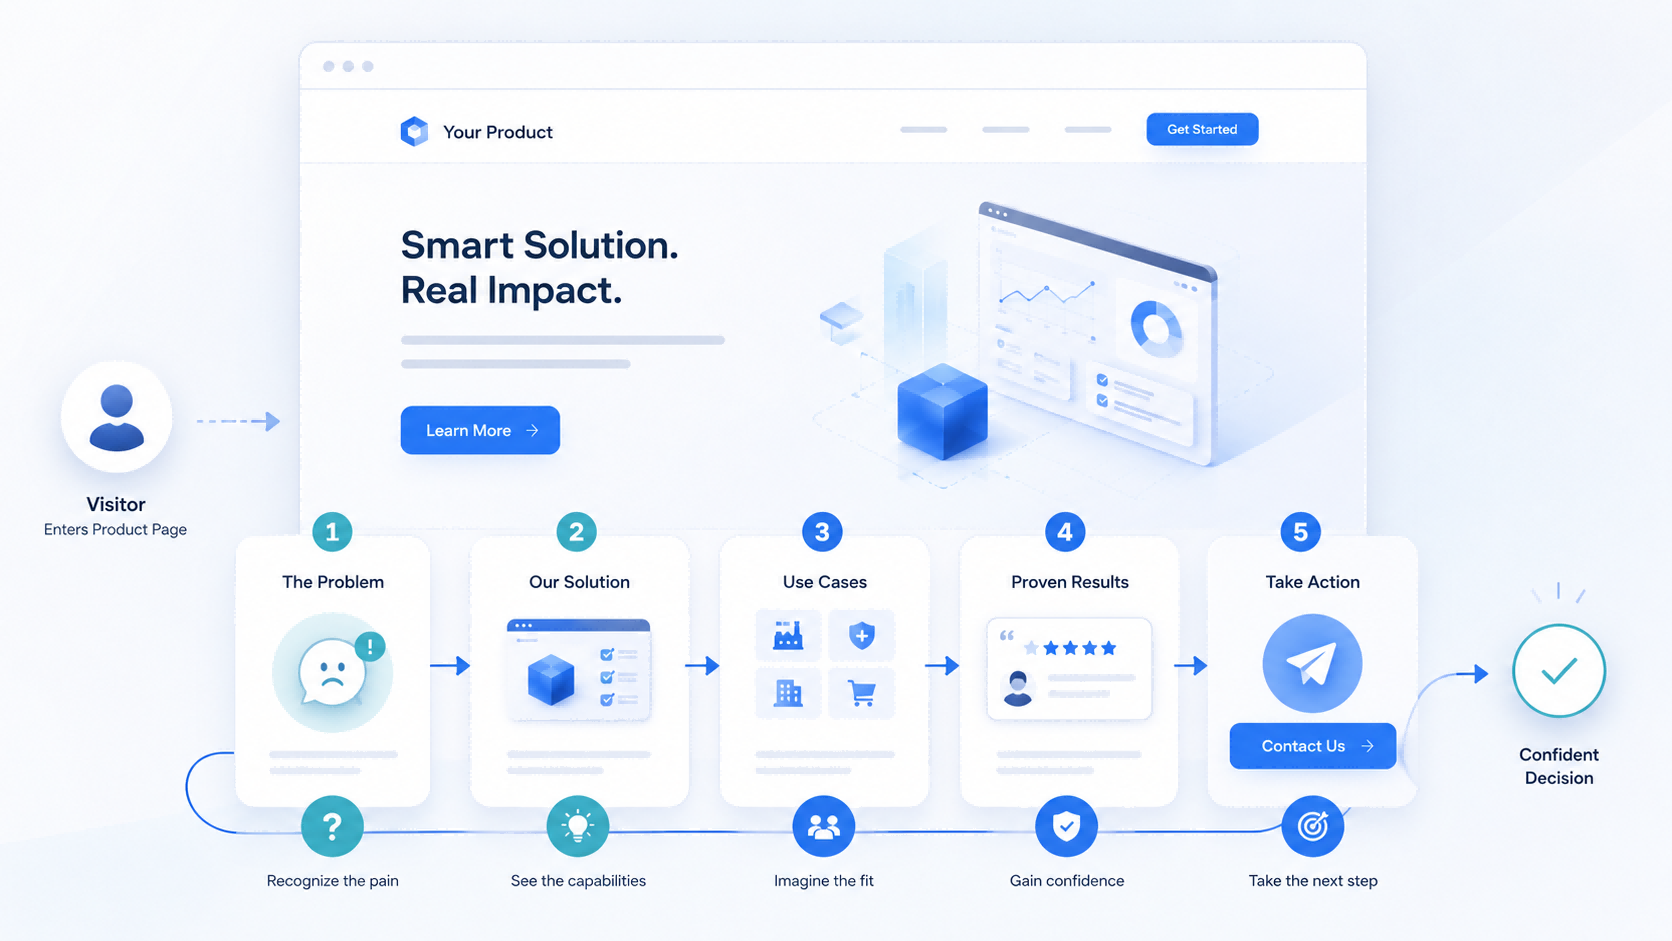
When target visitors reach the website but do not continue to product, case study, or contact pages, the landing page often fails to connect them with the information they need.
During website conversion rate analysis, do not simply ask whether the bounce rate is high. Ask whether customers can understand the following above the fold:
- What products or services the company provides;
- Which industries or purchasing scenarios it serves;
- What specific advantages it offers over other suppliers;
- What the customer can do next.
For B2B export websites, product pages should not merely list specifications. Customers also assess delivery capacity, certifications, MOQ, customization scope, production lead time, and after-sales support. If this information is scattered or missing, they often return to the search results to compare alternatives instead of submitting an inquiry.
4. Drop-off 3: The CTA is visible but not clicked or completed
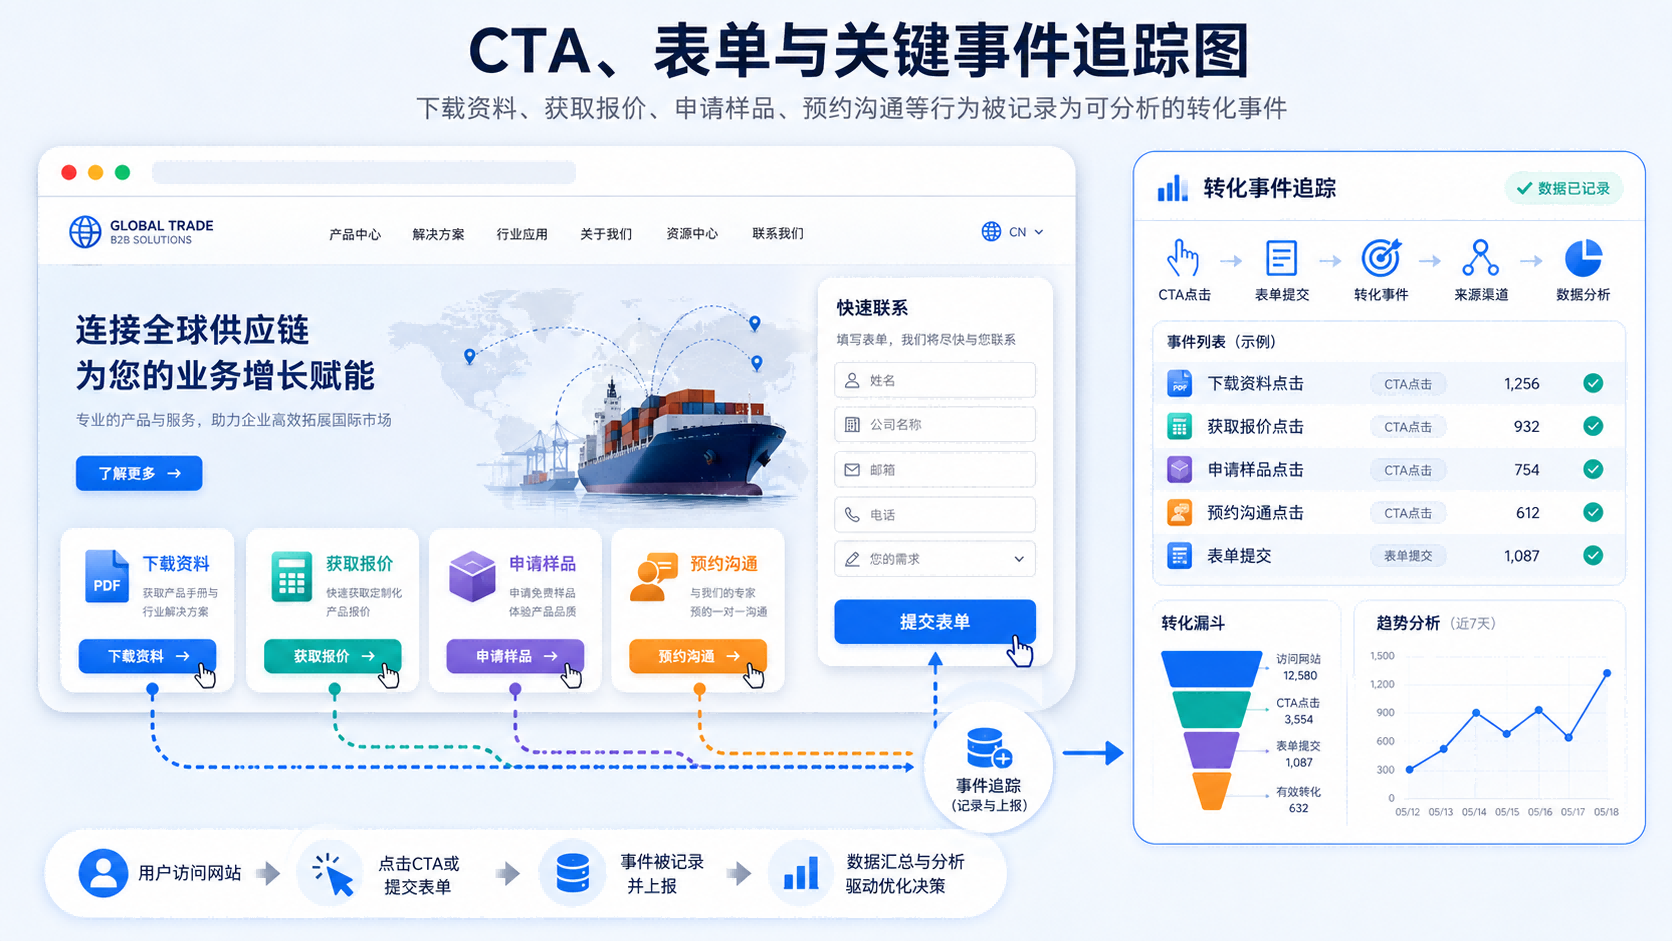
In website conversion rate analysis, CTA click-through rate and form completion rate must be measured separately. If visitors do not click the CTA, the value proposition may be unclear. If they begin the form but do not submit it, the form may be too long, fields may be confusing, privacy notices may be insufficient, or the page may not load properly.
Track at least four types of behavior:
Google Analytics 4 records website interactions as events. The form_start event can be collected automatically when enhanced measurement for form interactions is enabled. generate_lead is a recommended event but requires implementation, while click_cta and view_product usually need custom configuration. Funnel exploration can then compare completions and drop-offs at each step.
view_item (or custom view_product)
View a key product or solution;
click_cta (custom event)
Click an inquiry, download, booking, or similar entry point;
form_start
Begin completing a form;
generate_lead
Submit a form or another information request.
5. Drop-off 4: Form submissions do not enter an effective sales follow-up process
Some websites receive a healthy number of form submissions, yet sales teams still report too few opportunities. At this point, website conversion rate analysis must extend into the CRM instead of stopping at web analytics.
Check the following:
- Does every form submission have a clearly assigned owner?
- Is there a deadline for the first response?
- Do sales representatives record customer needs and next actions?
- Which pages, countries, or channels generate low-quality leads?
- Are prospects who did not proceed after receiving a quotation followed up continuously?
This stage directly affects the actual performance of export lead generation. Website inquiries are not customers that will close automatically. They are leads that need to be assigned, contacted, qualified, nurtured, and advanced. Without CRM feedback showing which leads were accepted, qualified, converted into opportunities, or won, marketing teams cannot optimize pages, content, or channel investment based on downstream results.
6. Use behavioral data to validate problems instead of guessing
Website conversion rate analysis should not rely on aggregated reports alone. Subject to appropriate privacy notices, consent management, and applicable regulations, teams can use heatmaps, click analysis, or session replay tools to validate the causes. For example, are users repeatedly clicking non-interactive elements, returning to a particular form field, viewing only the first screen, or failing to complete an action on mobile?
This is particularly valuable for international conversion optimization because behavior may vary across countries, devices, and language versions. Prioritize high-traffic pages with low conversion rates and representative sessions in which users began but did not submit a form. Mask sensitive fields or exclude them from data collection rather than browsing large numbers of random recordings.
7. Run an inquiry funnel diagnosis every week
Making website conversion rate analysis a routine is more effective than building a complex one-off report. Small teams can follow this weekly cadence:
Do not change too many pages or variables at once. Test one primary hypothesis at a time so it is easier to identify what caused inquiry volume to change.
Monday: Review the funnel.
Compare changes in visits, CTA clicks, form starts, and form submissions.
Tuesday: Review sources.
Segment data by country, language, channel, and landing page.
Wednesday: Review behavior.
Sample representative low-conversion sessions to see where users actually get stuck.
Thursday: Make one change.
For example, shorten a form, adjust a CTA, add case studies, or improve the above-the-fold message.
Friday: Review CRM feedback.
Confirm which leads were accepted and which were marked invalid during the week.
8. Conclusion
Low inquiry volume does not necessarily require an immediate budget increase. First use website conversion rate analysis to identify where customers actually leave. The business can then determine whether to improve traffic quality, content clarity, CTA design, form experience, or sales response processes.
Effective international conversion optimization should create a closed loop between website events and CRM outcomes such as lead acceptance, qualification, opportunity creation, and closed sales. It should also standardize definitions for traffic, CTA click-through rate, form completion rate, qualified lead rate, and sales response time so every optimization cycle can be compared reliably.
If your company is planning to improve an international corporate website’s conversion performance, data tracking, or CRM lead collaboration, explore our corporate website development services or visit Contact Us to discuss website data, inquiry funnels, and sales alignment with our consultants.


Further Reading
- Global Website Analytics Tools: How Adobe Analytics Drives Global Business Decisions
Learn how to break down international website performance by country, channel, page, and customer behavior. - Essential Elements of a Global B2B Website: Strengthen International Competitiveness from Structure to Content
Continue improving your international website’s content architecture, trust signals, and lead generation foundation.
Recommended Articles

Enterprise AI MarTech Trends Analysis 2024-2029 Outlook Report
From AI content productivity tools to a core engine for revenue growth and marketing transformation
*The PDF will be sent directly to your inbox.
Email Error
Please enter a valid email address.
Thank You!
The whitepaper has been sent to your inbox. If you don’t see it, please check your spam or promotions folder.