
Core Web Vitals Optimization Guide: Improve LCP, INP, and CLS
UX/UI Design, Website Analytics
16 September 2026
A website that feels fast on a high-speed office connection may deliver a very different experience on a phone. Slow-loading images, unresponsive clicks, and buttons that suddenly move can cause customers to abandon browsing or submitting an inquiry. Core Web Vitals turn these real experiences into measurable indicators. When diagnosing website performance, LeadsTech weighs real user data, the business value of each page, and technical bottlenecks together, so the pursuit of speed scores does not overshadow the customer journey. This guide explains how to interpret the data, identify causes, and prioritize fixes by business impact.
Key Takeaways (TL;DR)
Core Web Vitals measure loading, responsiveness, and visual stability through LCP, INP, and CLS, respectively. The thresholds for a good experience are an LCP of 2.5 seconds or less, an INP of 200 milliseconds or less, and a CLS of 0.1 or less, evaluated at the 75th percentile of real user experiences. Start with field data from CrUX or RUM, then use lab data from tools such as Lighthouse to reproduce issues. Prioritize page groups and their conversion value instead of chasing a score of 100 in a single test.
1. What Are Core Web Vitals, and Why Do They Matter to Businesses?
Core Web Vitals are a set of key metrics Google uses to measure real-world page experience: how quickly the main content appears, how quickly the page responds to interaction, and whether its layout shifts unexpectedly. These metrics reflect whether people can quickly see, use, and trust a page, rather than simply assigning it a technical score.
Google recommends achieving good Core Web Vitals because page experience is one of many factors its core ranking systems consider. Passing the assessment does not guarantee higher rankings, however. Content relevance, quality, links, search intent, and other experience signals still matter. For your business, the more immediate value is reducing abandonment, accidental clicks, and time spent waiting for actions to complete.
2. How to Interpret LCP, INP, and CLS
Evaluate the 75th percentile: at least 75% of real browsing experiences should meet the thresholds. Differences in device speed, mobile networks, login state, and region across your traffic can produce real-world results that look very different from internal tests.
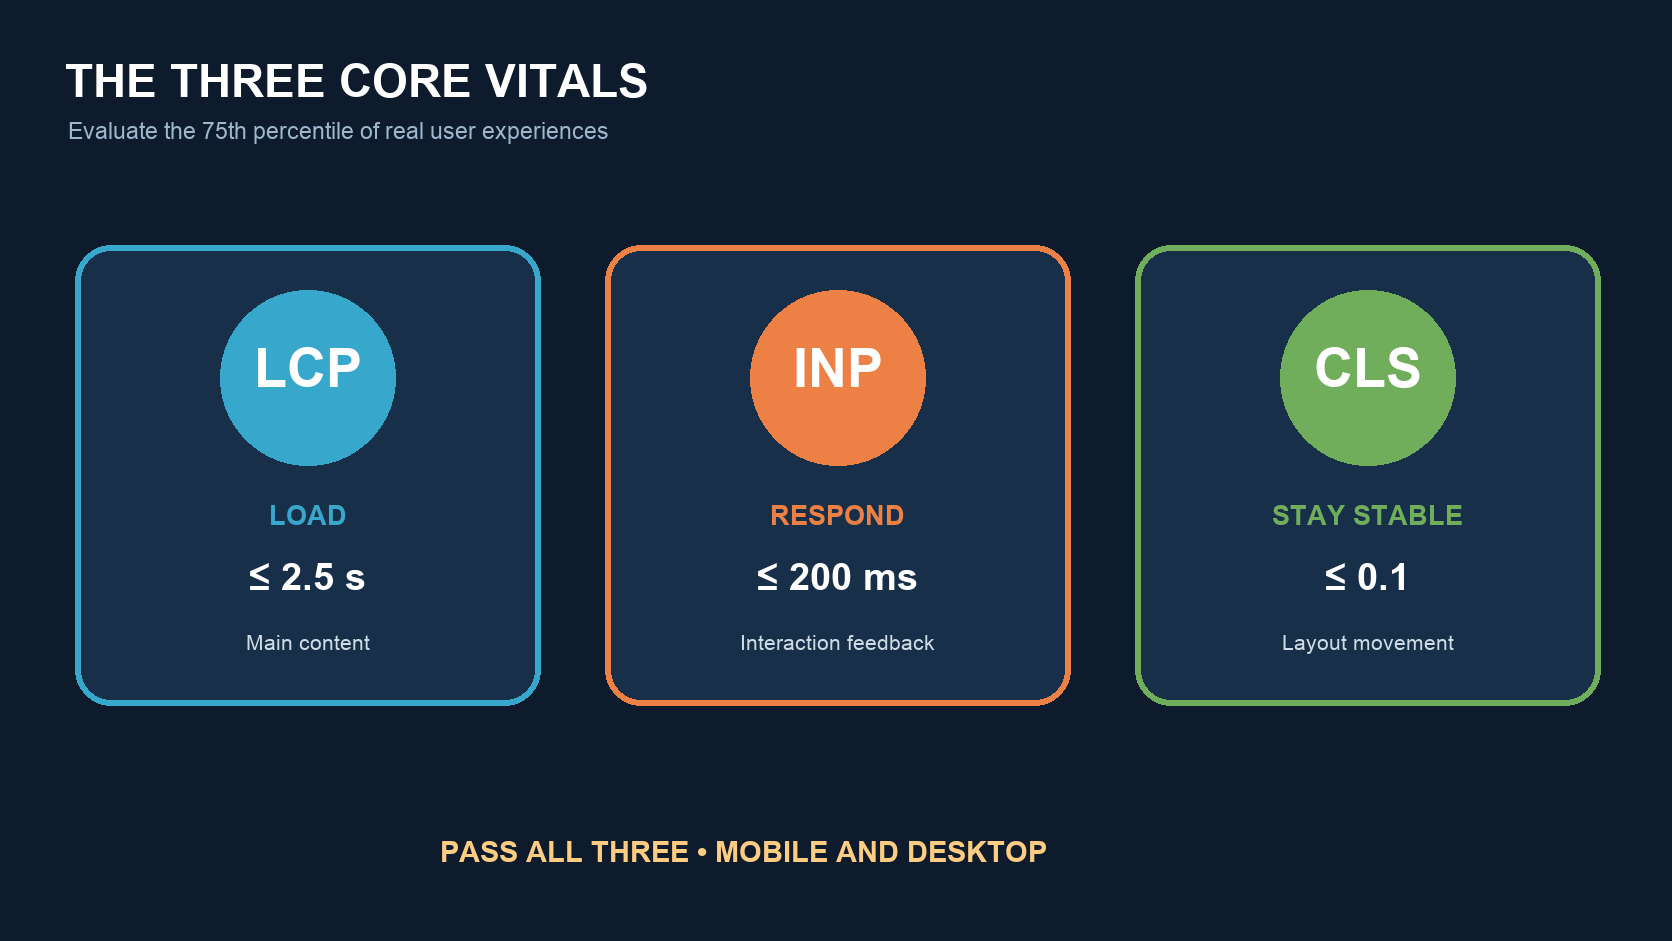
- Largest Contentful Paint (LCP): Measures how long it takes the main content element to finish appearing. A good result is 2.5 seconds or less. Common elements include a hero image, a large heading, or a main content block.
- Interaction to Next Paint (INP): Assesses responsiveness throughout a browsing session. A good result is 200 milliseconds or less. The visual response after opening a menu, filtering products, or opening a form can all affect INP.
- Cumulative Layout Shift (CLS): Measures unexpected layout movement. A good result is 0.1 or less. Shifts commonly occur when space has not been reserved for images, ads, fonts, or content inserted later.
A page must meet the good threshold for all three metrics to pass the overall Core Web Vitals assessment. Check mobile and desktop separately because their processing power, networks, viewports, and interaction methods differ.
3. Why Do Field Data and Lab Data Differ?
Field data comes from real users. The Chrome UX Report (CrUX) aggregates eligible Chrome browsing experiences, and both PageSpeed Insights and the Core Web Vitals report in Search Console use this type of data. PageSpeed Insights generally shows a rolling window covering the past 28 days. Search Console groups URLs with similar experiences to help identify patterns across a website.
Lab data comes from tests run under controlled device and network conditions, such as Lighthouse tests. It helps reproduce issues, analyze them step by step, and verify fixes, but it cannot represent every real visitor. A website can perform well in Lighthouse while still failing in field data. Real devices may be slower, third-party scripts may load only in certain states, or visitors may perform interactions the lab test does not cover.
Use field data to identify problems, lab data to diagnose them, and then Real User Monitoring (RUM) and subsequent field data to validate improvements. Pages with little traffic may lack URL-level CrUX data. In that case, refer to origin-level data, groups of similar pages, and your own RUM implementation.
4. How to Improve LCP Loading Speed
First identify the actual LCP element; do not assume it is the hero image. Break LCP down into server response time, resource discovery delay, resource download time, and element rendering to locate the right bottleneck.
- Improve server and CDN caching to reduce Time to First Byte (TTFB).
- Make the LCP image discoverable in the initial HTML instead of inserting it late through JavaScript.
- Do not lazy-load the above-the-fold LCP image. Use preload or fetch priority where needed.
- Provide appropriate image dimensions, responsive sources, and efficient formats to avoid downloading files far larger than their displayed size requires.
- Reduce CSS, fonts, and synchronous JavaScript that block above-the-fold rendering, and defer nonessential third-party scripts.
- For dynamic websites, pregenerate or cache high-traffic pages to avoid expensive backend computation on every request.
A common mistake is to compress images without addressing a slow server, late resource discovery, or JavaScript that blocks the main content. After every change, revisit the timing breakdown to verify its effect.
5. How to Improve INP Responsiveness
INP problems usually arise when the main thread is too busy. After a user clicks, the browser may still be running long JavaScript tasks, calculating styles, or making extensive DOM updates, preventing the screen from providing timely feedback.
- Record the slowest interaction types, elements, URLs, devices, and states on real pages.
- Break long tasks into smaller units of work so the browser has opportunities to handle input and paint.
- Reduce initial JavaScript, split code by page and feature, and load only what is currently needed.
- Avoid large DOM updates and repeated layout reads and writes; batch UI changes.
- Check how third-party scripts for tag management, chat, personalization, and analytics affect the main thread.
- Provide immediate visual feedback when an action begins, and defer nonessential follow-up work.
INP does not measure only the first click. As visitors spend more time on a page, menus, filters, add-to-cart actions, pagination, and form validation can each become the slowest interaction. Test complete tasks instead of merely loading the homepage.
6. How to Improve CLS Visual Stability
The key to CLS is reserving space. Set width, height, or aspect-ratio for images and videos. Give ads, recommendations, cookie banners, and dynamic components stable containers. Avoid inserting content above existing paragraphs while someone is reading.
Custom font swaps can cause text to reflow. Use suitable fallback fonts, font preloading, and font metric adjustments. Prefer transform and opacity for animations, rather than changes to top, left, width, or height that trigger layout recalculation. Test different states, including login, personalization, ads, and error messages.
7. Hypothetical Example: Diagnosing an E-commerce Campaign Page
Suppose an e-commerce campaign page tests well in the office, but mobile conversions are falling. Search Console shows that the product page group fails LCP and INP. PageSpeed Insights reveals that a carousel script inserts the hero image late and that product filtering runs a large amount of JavaScript at once. A promotional banner inserted at the top of the page after loading also causes CLS.
The team could place the first hero image directly in the initial HTML with the right dimensions and priority, split the filtering code and reduce unnecessary DOM updates, and reserve height for the promotional banner. At launch, monitor a small share of traffic first. Use RUM to compare the LCP element, slowest interactions, and sources of CLS, then allow the rolling 28-day field data to gradually reflect the changes.
Alongside the three metrics, business teams should track the product-view-to-add-to-cart rate, checkout initiation rate, error rate, and revenue. If performance improves but conversions do not change, also examine pricing, content, inventory, forms, and the quality of marketing traffic.
8. A Core Web Vitals Optimization Workflow
Start with real data and narrow the investigation to reproducible causes, then release changes safely and monitor continuously. Optimization should follow that process rather than begin with random changes.
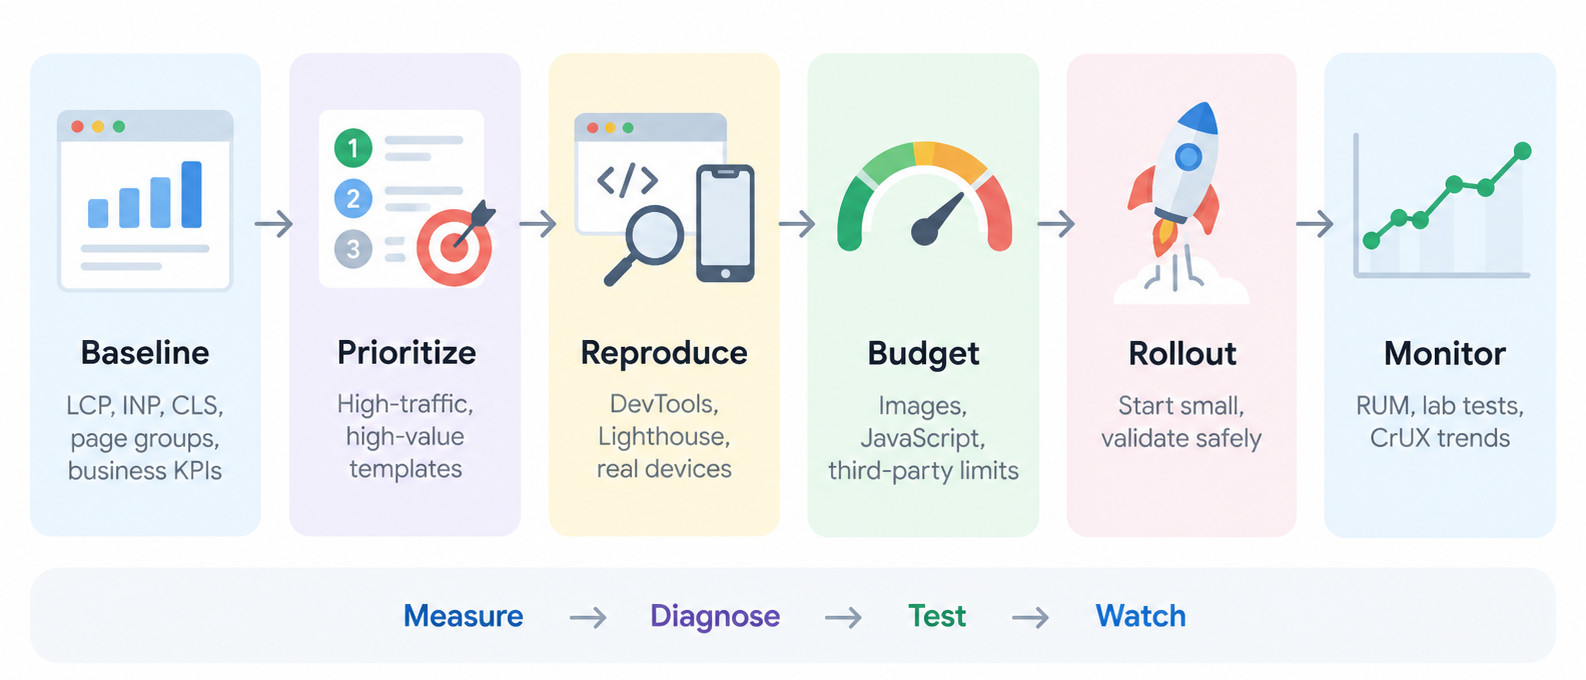
1. Establish a Baseline
Record mobile and desktop LCP, INP, and CLS, along with key page groups and business metrics.
2. Prioritize by Value
Start with templates that receive high traffic, drive important revenue or inquiries, and have clearly identified problems.
3. Reproduce the Causes
Use DevTools, Lighthouse, real devices, and different page states to confirm bottlenecks.
4. Set Performance Budgets
Define testable limits for images, JavaScript, third-party scripts, and each metric.
5. Release Incrementally
Validate changes on one template or a share of traffic first to avoid introducing functionality or tracking errors.
6. Monitor Continuously
Use RUM and automated lab tests to detect regressions early, then confirm real-world improvements through CrUX trends.
9. Launch and Monitoring Checklist
- Are you evaluating all three metrics at the 75th percentile rather than using averages?
- Have you checked mobile and desktop separately?
- Do you know which element is the LCP element and which interactions are slowest?
- Have you reserved space for images, videos, ads, and dynamic modules?
- Does each third-party script have an owner, a purpose, and a performance budget?
- Have you tested the main conversion journeys on real devices?
- Does your release pipeline include Lighthouse or other performance regression checks?
- Does RUM capture the page template, device, region, and version?
- Are you tracking conversions, errors, and revenue alongside technical scores?
10. Frequently Asked Questions
Does a PageSpeed Insights Score of 100 Mean a Site Passes Core Web Vitals?
No. A Lighthouse score comes from a single lab test. Passing Core Web Vitals depends primarily on eligible real user field data.
Why Does Search Console Still Show a Failure After a Fix?
Field data uses a rolling time window, so new data gradually replaces older experiences. First verify the change with lab tests and RUM, then monitor the trend over roughly 28 days.
Does Missing CrUX Data Mean the Website Performs Well?
No. The URL or origin may simply lack enough eligible samples. Use Lighthouse, real devices, and your own RUM implementation to measure performance.
Do Core Web Vitals Directly Determine Google Rankings?
They do not determine rankings on their own. Google considers page experience among many signals, and relevance and content quality remain important. Performance improvements should also serve user needs and business outcomes.
Should We Improve LCP, INP, or CLS First?
Start with the issues affecting the most high-value pages and users. If all three metrics fail, fix shared causes across templates first, then address exceptions on individual pages.
11. Conclusion
Core Web Vitals optimization is an ongoing effort to bring real user experience into product, content, development, and operational decisions. Establish a field data baseline, investigate causes in order of page value, and use safe releases and continuous monitoring to prevent regressions. If you need real user diagnostics, performance testing, or a plan for fixes, explore LeadsTech’s Website Performance Testing and Optimization services or contact our team to discuss your needs.


12. Further Reading
- How Does a CMS Affect SEO? A Guide to Optimizing Your Content Management System: Understand the relationship between content platforms, templates, and technical SEO.
- Website Data Analysis and Optimization: Applying Adobe Analytics and CDP: Connect performance data with customer behavior and conversions.
- SEO, GEO, and AI Search Growth Strategies: Increase Brand Visibility and Business Opportunities: Explore search visibility and website growth strategies.
Related Articles

Enterprise AI MarTech Trends Analysis 2024-2029 Outlook Report
From AI content productivity tools to a core engine for revenue growth and marketing transformation
*The PDF will be sent directly to your inbox.