
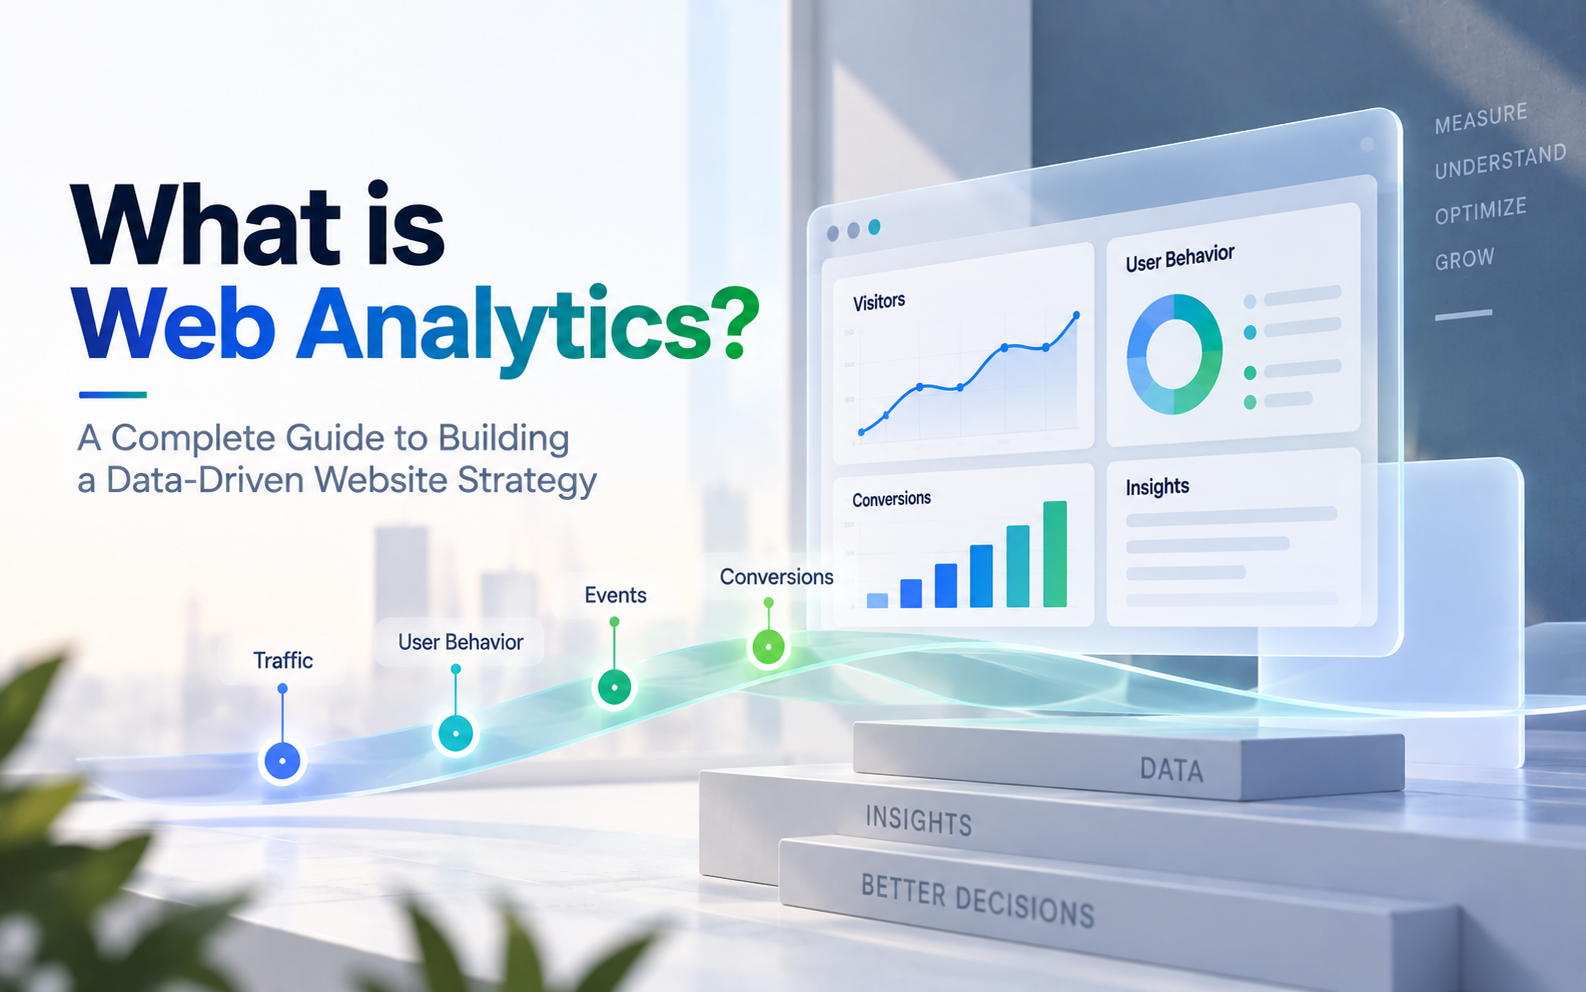
What Is Web Analytics? A Business Framework for Traffic, User Behavior, and Conversions
Adobe Analytics, Google Analytics, Website Analytics
25 September 2026
Traffic alone does not tell you whether your website is working. You need to know where visitors come from, what they view, where they leave, which content generates inquiries, and whether your campaigns ultimately create business value. Web analytics turns website interactions into data you can track, compare, and use to improve performance over time.
1. Summary
Web analytics uses data to track, measure, and interpret how people use a website. A mature approach goes beyond page views and sessions to connect traffic sources, user behavior, events, content engagement, conversions, and business outcomes. Start by defining your objectives and tracking requirements, then establish a consistent structure for events and conversions. Use funnel, path, segmentation, and attribution analysis to identify opportunities for improvement.
2. What Is Web Analytics?
Web analytics is a systematic way to measure website performance. It records the data generated when people interact with your site, including how they arrived, which pages they viewed, and whether they clicked a call to action (CTA), downloaded a document, submitted a form, logged in, made a purchase, or completed another important task.
The value comes from answering business questions, not simply collecting more numbers. Does traffic from SEO convert more readily than traffic from paid advertising? Do visitors to a product page read the specifications, download a catalog, or contact sales? Did a website redesign improve form completion rates? If your analytics tool produces reports but cannot support these decisions, you have yet to build an effective analytics capability.
3. How Does Web Analytics Differ From Standard Reporting?
Standard reports typically show what happened: how many visitors arrived this month, which pages were most popular, and how many conversions occurred. Web analytics goes further to investigate why those results occurred and what you should do next.
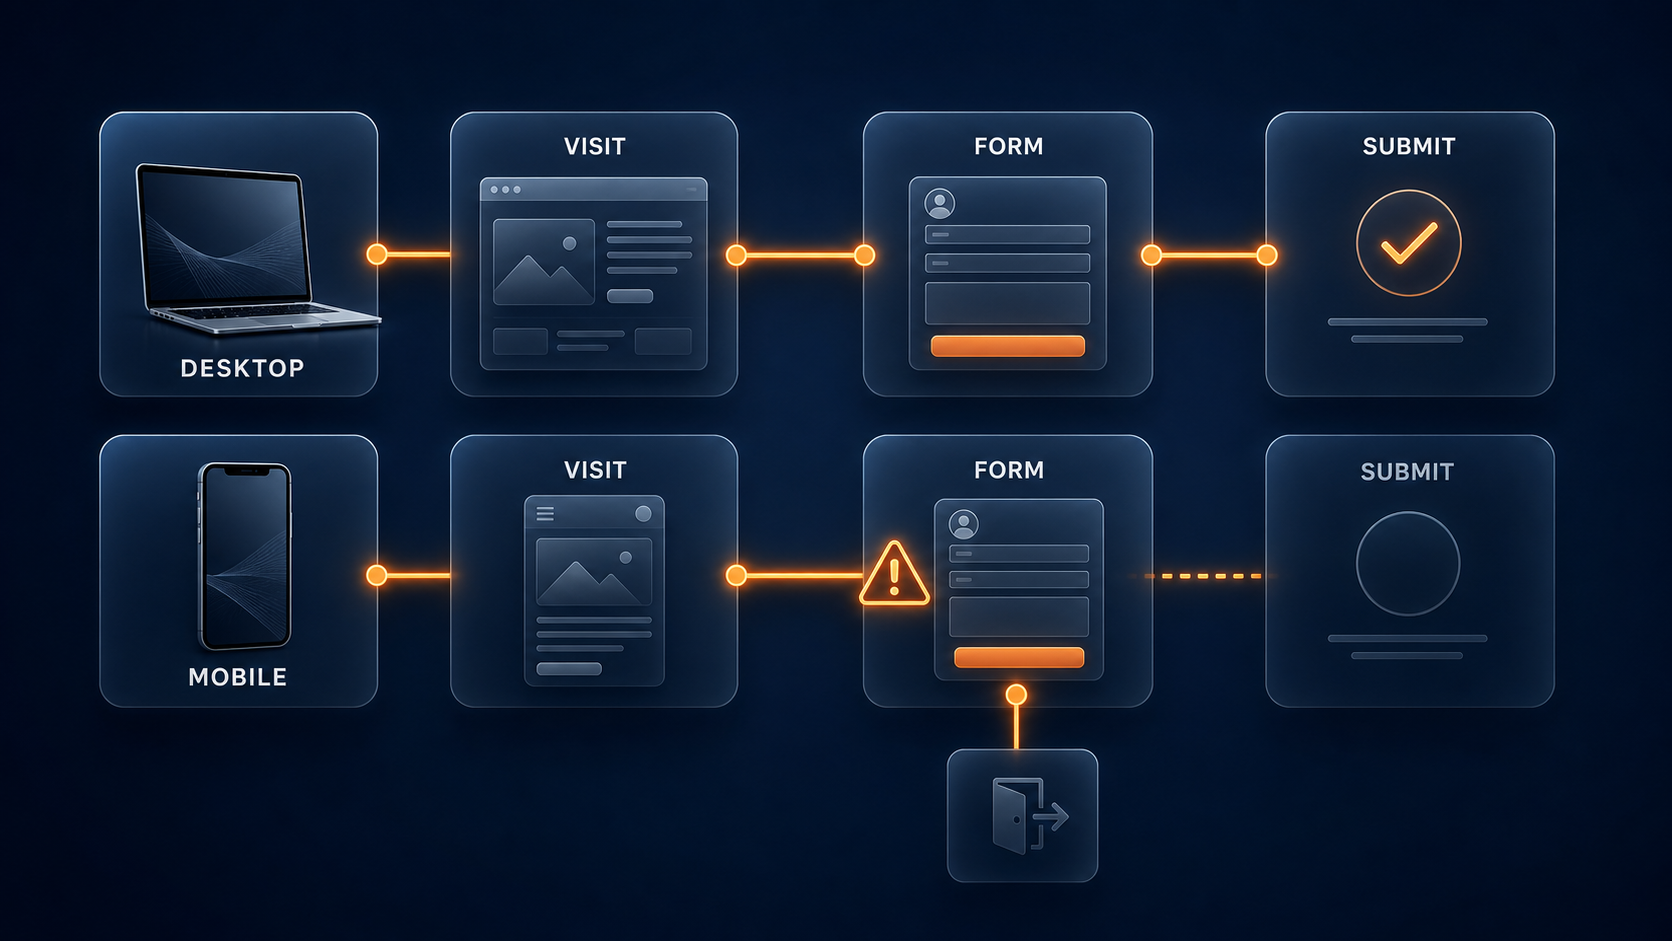
Suppose traffic to a product page increases, but form submissions do not. A traffic report alone might suggest that the page is performing well. Further analysis could reveal that most visitors arrive through informational keywords, miss the CTA, abandon the form on mobile devices, or find content that does not match their search intent. Web analytics helps uncover these differences and clues to their causes.
4. Which Layers of Website Performance Should You Analyze?
Layer 1: Traffic
Understand traffic from organic search, paid search, social media, referrals, email, direct visits, and campaigns, along with the quality of the visitors each source attracts.
Layer 2: User Behavior
Examine entry pages, browsing depth, content engagement, on-site searches, CTA clicks, downloads, video views, and the paths visitors take between important pages.
Layer 3: Conversions
B2B websites may prioritize form submissions, demo requests, white paper downloads, event registrations, or account sign-ups. E-commerce sites typically track add-to-cart actions, checkout, purchases, and revenue.
Layer 4: Business Value
Organizations with mature analytics connect website behavior to CRM, marketing automation, or order data. This shows which sources and content generate qualified leads, sales opportunities, revenue, or customer retention, extending measurement beyond website conversion counts.
5. A Complete Framework From Traffic to Conversions
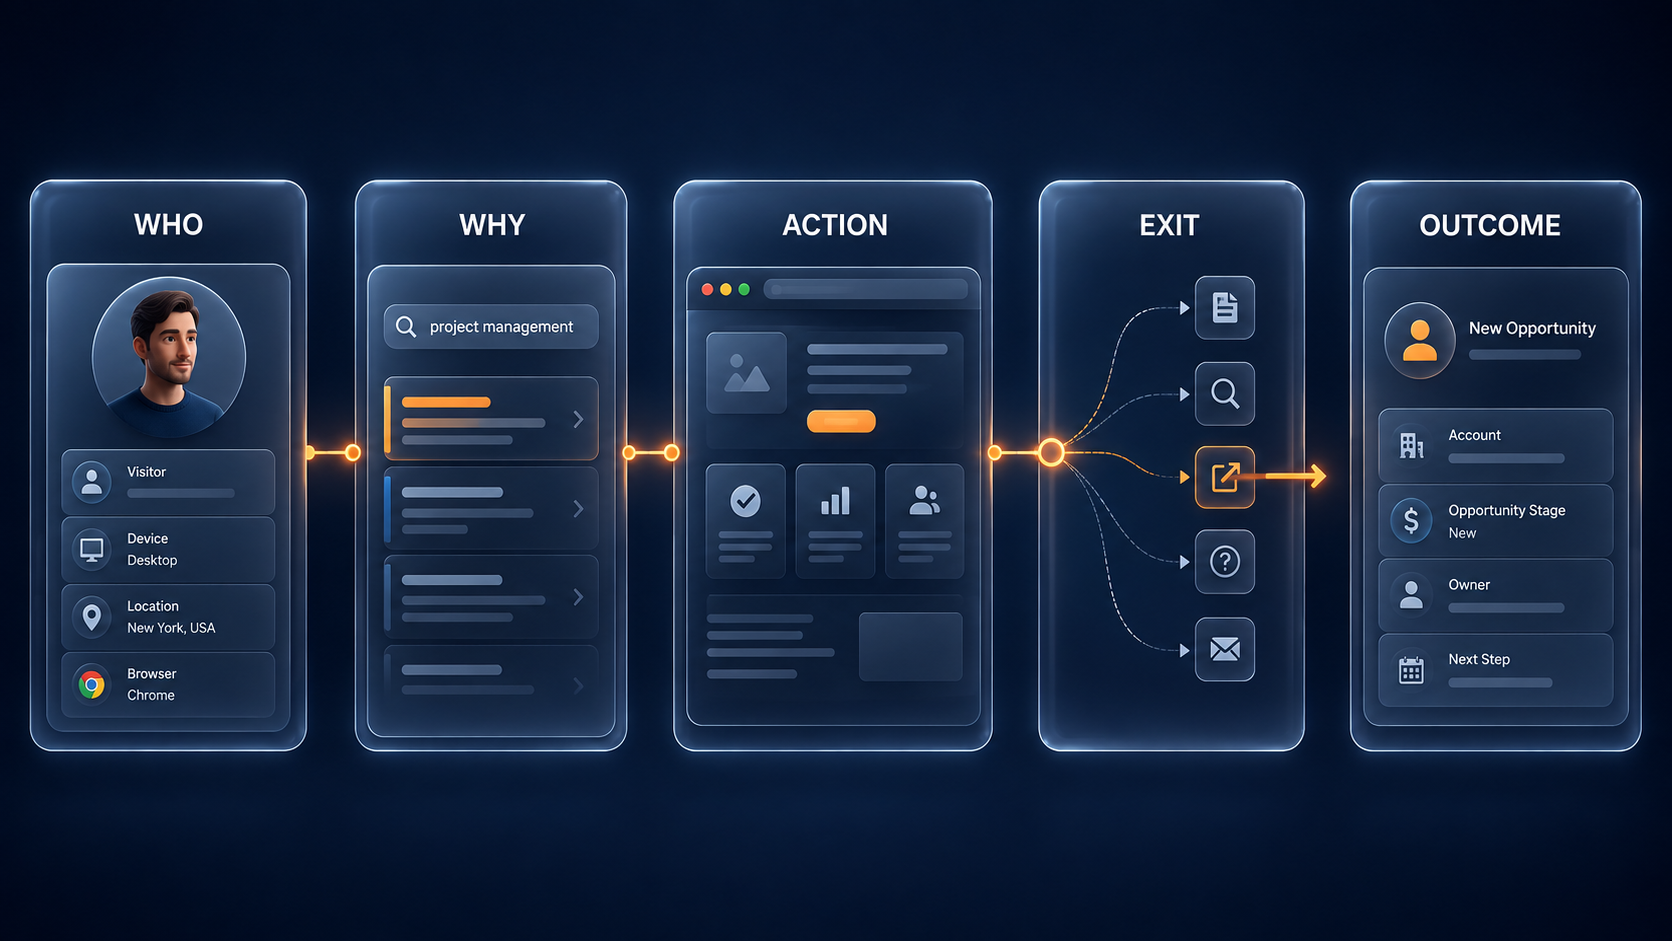
Use five questions to structure your web analytics framework.
1. Who Visits Your Website?
Analyze new and returning visitors, locations, devices, traffic sources, campaigns, and audience characteristics.
2. Why Are They Visiting?
Assess visitor intent by considering search keywords, landing pages, content topics, and campaign design together.
3. What Do They Do on Your Website?
Track page views, CTA interactions, downloads, searches, video engagement, form starts, and other important events.
4. Where Do They Leave?
Use funnels, paths, exit pages, error events, and device segments to identify the steps that prevent visitors from converting.
5. What Outcomes Do They Generate?
Connect key events or conversions to CRM data and measures such as revenue, sales opportunity stages, and marketing-qualified leads.
6. What Data Should You Track?
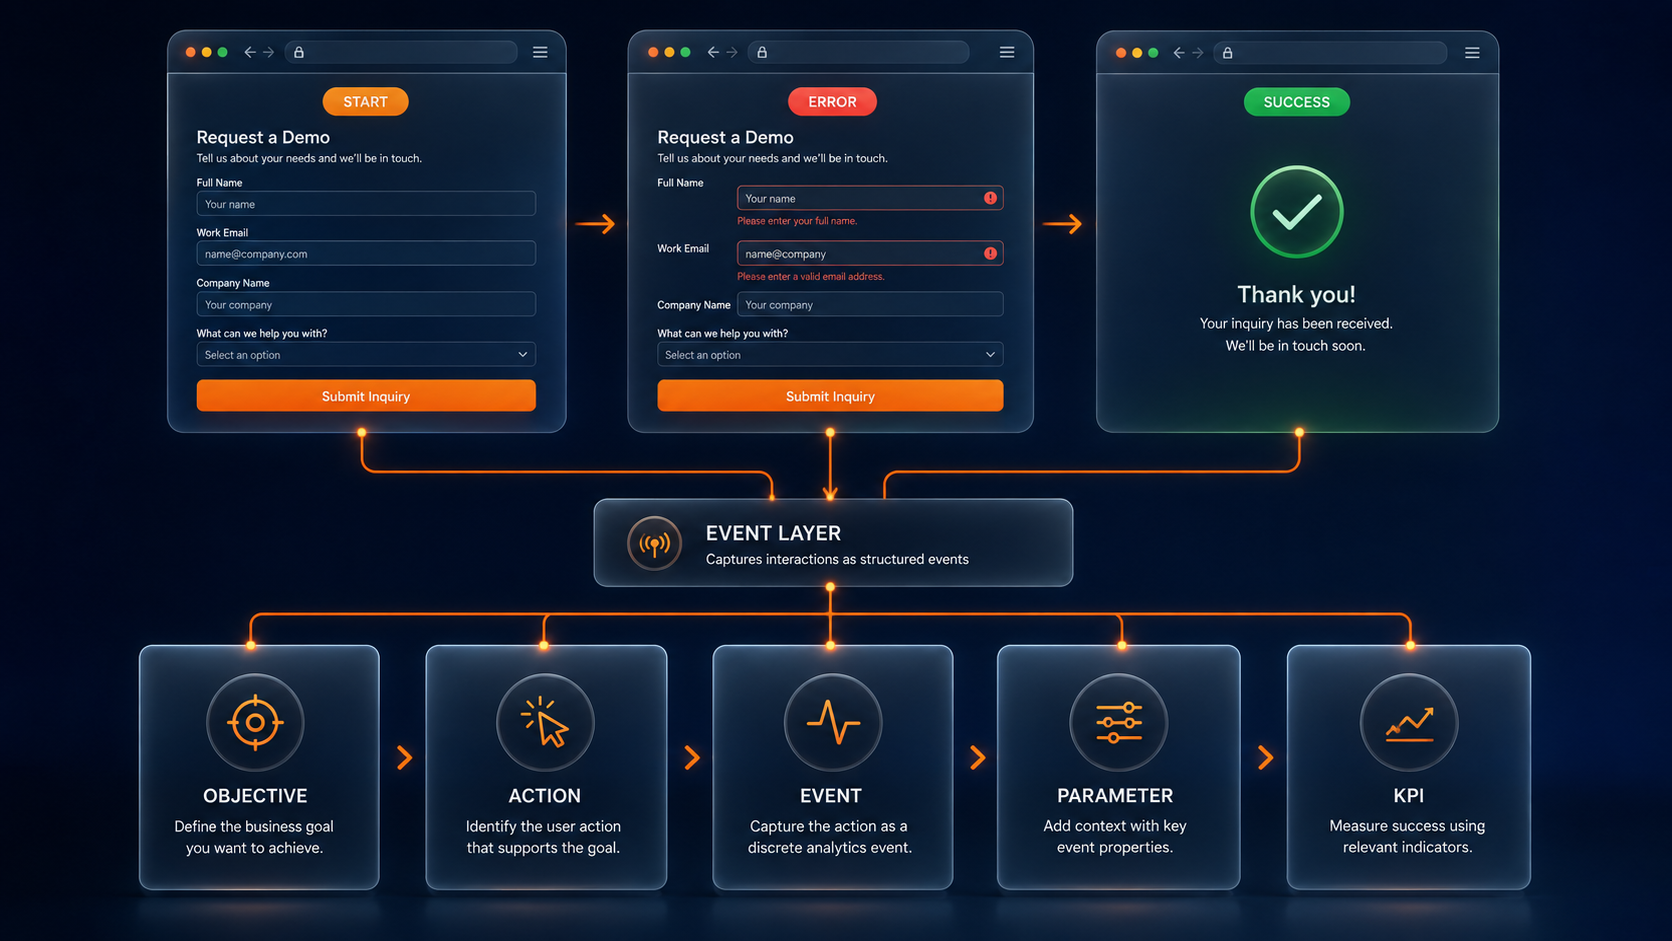
Not every button click needs to be a priority event. Start with a measurement plan that maps each website goal to a business objective, user action, event, parameter, and KPI.
For example, if your goal is to increase business inquiries, you might track CTA clicks, form starts, form errors, form submissions, thank-you page views, lead sources, and product interests. If you want to strengthen the impact of your content, track article readership, scroll depth, downloads, internal link clicks, and subsequent conversions.
Establish naming conventions and data quality controls at the same time. Are event names consistent? Do campaign UTM parameters follow a standard? Is cross-domain tracking configured correctly? How does cookie consent affect measurement? Is development traffic separated from production traffic? Without governance, collecting more data can make it harder to trust.
7. How Do You Turn Data Into Action?
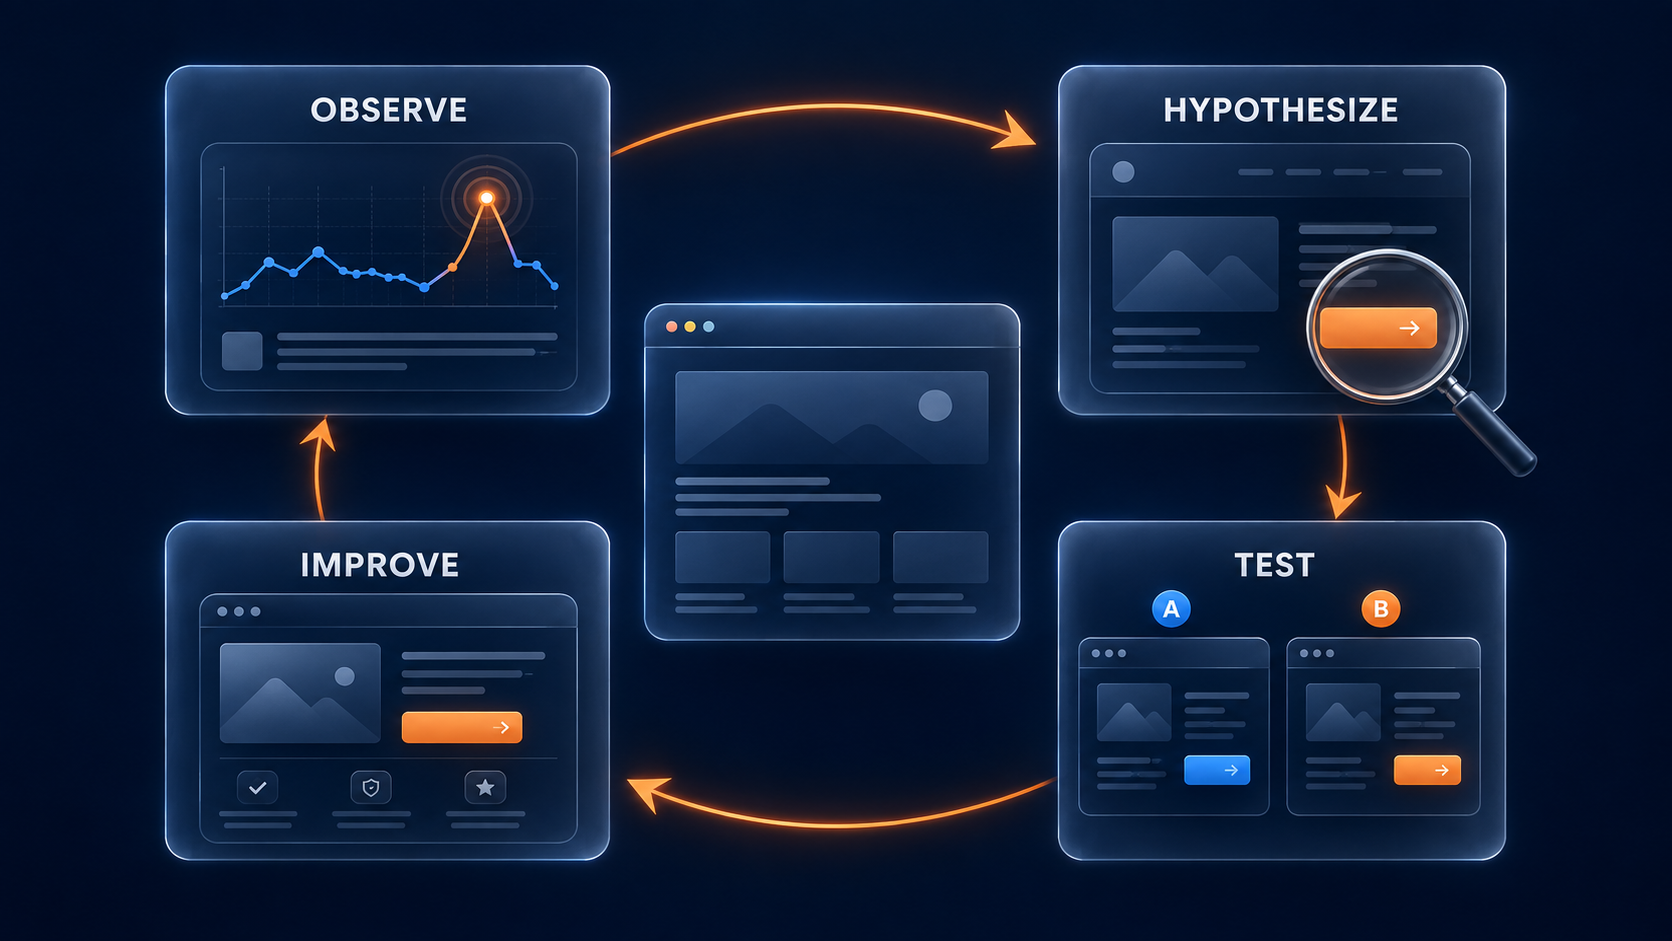
Build a regular cycle of observation, hypothesis, validation, and improvement. First, identify an anomaly or opportunity, such as a high-traffic landing page with a low conversion rate. Then propose an explanation: perhaps the CTA is difficult to notice, or the content does not match search intent. Test that hypothesis through segmentation, path analysis, funnel analysis, user testing, or A/B testing, and monitor how the metrics change after you make an improvement.
Avoid relying on averages alone. Behavior can differ substantially between desktop and mobile visitors, Taiwan and overseas markets, new and returning visitors, or organic and paid traffic. Comparing user segments often reveals the underlying problem more clearly than an overall conversion rate.
8. Common Web Analytics Implementation Challenges
1. Implementing Tools Before Defining Requirements
Waiting until GA4 or Adobe Analytics is live to discuss what to track often leads to missing events and inconsistent naming.
2. Tracking Too Many KPIs
A dashboard with dozens of metrics can make it difficult for teams to focus. Choose a small set of core KPIs for each website or journey, then use supporting metrics to explain the results.
3. Disconnecting Analytics From Business Outcomes
Your website may generate many conversions, but if your CRM cannot identify their sources, marketing and sales still cannot tell which content creates sales opportunities. Gradually connect analytics with your CRM, marketing automation platform, CDP, or data warehouse.
4. Producing Monthly Reports Without Making Improvements
The goal of web analytics is to establish a continuous improvement process, beyond compiling monthly traffic reports. Content, UX, SEO, advertising, and development teams should all be able to use the data to guide changes.
9. Frequently Asked Questions
Do You Have to Use GA4 for Web Analytics?
No. GA4 meets standard website and app analytics needs for many organizations. If you have more complex requirements for data governance, dimension design, advanced segmentation, cross-channel analysis, or an Adobe Experience Cloud architecture, you may also want to evaluate Adobe Analytics or other options.
What Is the Most Important Web Analytics KPI?
There is no universal KPI. Select metrics that reflect the purpose of your website. A B2B corporate site might prioritize qualified leads, form conversion rates, and content-assisted conversions. An e-commerce site might emphasize revenue, purchase conversion rates, and average order value.
How Often Should You Review Web Analytics?
Monitor urgent operational issues daily, review campaigns and conversions weekly, and analyze trends in content, SEO, UX, and business performance monthly or quarterly. Every metric should have an owner and a clear follow-up action.
10. Conclusion
Web analytics provides a foundation for understanding digital customer behavior, assessing marketing investments, and continuously improving the website experience. A consistent framework that connects traffic, behavior, events, funnels, conversions, and business outcomes turns fragmented data into evidence for better decisions.
If you want to establish comprehensive website analytics, tracking, and a continuous improvement process, explore LeadsTech’s analytics and digital experience services:
For help reviewing your existing tracking, KPIs, or GA4 or Adobe Analytics architecture, contact LeadsTech:


Related Articles

Enterprise AI MarTech Trends Analysis 2024-2029 Outlook Report
From AI content productivity tools to a core engine for revenue growth and marketing transformation
*The PDF will be sent directly to your inbox.