

Website performance reports contain plenty of numbers, yet customers may still find a site slow even after its overall score improves. Understanding which part of the experience each metric describes helps you diagnose issues, prioritize improvements, and validate results. LeadsTech can help with website performance diagnosis and optimization planning, connecting metrics to visitor tasks and acceptance criteria. This guide explains how Core Web Vitals, loading behavior, and test conditions can turn a performance report into an actionable backlog.
Summary
Assess content loading, responsiveness, and visual stability together rather than judging website quality by one score. Core Web Vitals provide a shared way to measure experience; supporting metrics help locate where users are waiting. Combine lab and real-world data, document page types, devices, and reporting periods, and prioritize work by business impact. Acceptance testing should verify that visitors can complete important tasks as well as compare the numbers.
1. Decide What Website Performance Metrics Should Explain
Interpret Numbers Through Customer Tasks
Visitors may need to check product specifications, find the services you offer, or submit an inquiry. When content appears, when buttons respond, and whether the layout shifts unexpectedly all affect those tasks.
A performance report turns “it feels slow” into observable behavior. If main content appears late, investigate the loading path. If the page looks complete but interactions freeze, analyze the work performed during those interactions.
Before testing, list representative page types and actions. Home pages, product details, articles, internal search, and forms can have different bottlenecks. A single home-page measurement cannot represent every visitor’s experience.
Distinguish Outcome Metrics from Diagnostic Metrics
Outcome metrics reflect what visitors experience, such as when main content appears or how quickly an interaction receives a response. Diagnostic metrics help explain why, including initial response time, resource size, or time spent occupying a thread.
Availability and error rates add another perspective: a failed service request interrupts the task even on a fast page. Define which actions count as successful and which attempts belong in the denominator so success rates can be interpreted consistently.
Use both types of metrics together. Finding a large image does not prove that it is the main bottleneck. A slow server response does not establish that changing hosting is the only solution. Investigate the complete loading and rendering path.
Ideally, connect every reported number to a problem, supporting evidence, and a next step. This gives business and technical teams a better basis for discussing priorities than a list of tool recommendations alone.
2. Understand the Three Dimensions of Core Web Vitals
Core Web Vitals measure loading performance, responsiveness, and visual stability. Each addresses a different aspect of experience. They cannot substitute for one another, and their values should not simply be added together.
LCP: When Does the Main Content Appear?
Largest Contentful Paint (LCP) measures when the largest content element in the viewport is painted. The good threshold is 2.5 seconds or less, making it useful for assessing how long visitors wait for the main content.
First identify the element being measured. Different screen sizes or page versions may make it an image, a video, or a large block of text. Before optimizing, establish which content actually determines the value.
For a slow LCP, examine initial response time, resource discovery, downloading, and the wait before display. Image compression is only one possible remedy. Delays elsewhere in the path require different changes.
INP: How Soon Does an Interaction Produce Visual Feedback?
Interaction to Next Paint (INP) measures the delay from a click, tap, or keyboard interaction to the next paint showing the page’s response. The good threshold is 200 milliseconds or less.
Reproduce important interactions, such as opening menus, switching product specifications, searching, or clicking a form button. Seeing a page does not mean that users can interact with it smoothly at that moment.
Separate input delay, event processing, and the visual update when analyzing the result. Heavy code execution on the main thread can temporarily delay feedback. Locate that work before deciding how to reduce or split it.
CLS: Does the Layout Move Unexpectedly?
Cumulative Layout Shift (CLS) describes the extent of unexpected layout movement. The good threshold is 0.1 or less. This is a unitless score, not a loading time in seconds.
Common scenarios include images pushing text down as they appear, embedded content being inserted, and font swaps changing the layout. Inspect actual shift records rather than guessing the source from a visual impression.
Stability must also be assessed throughout a visit. Shifts can occur after a visitor scrolls to a form or expands information, so testing should extend beyond the moment the page opens.
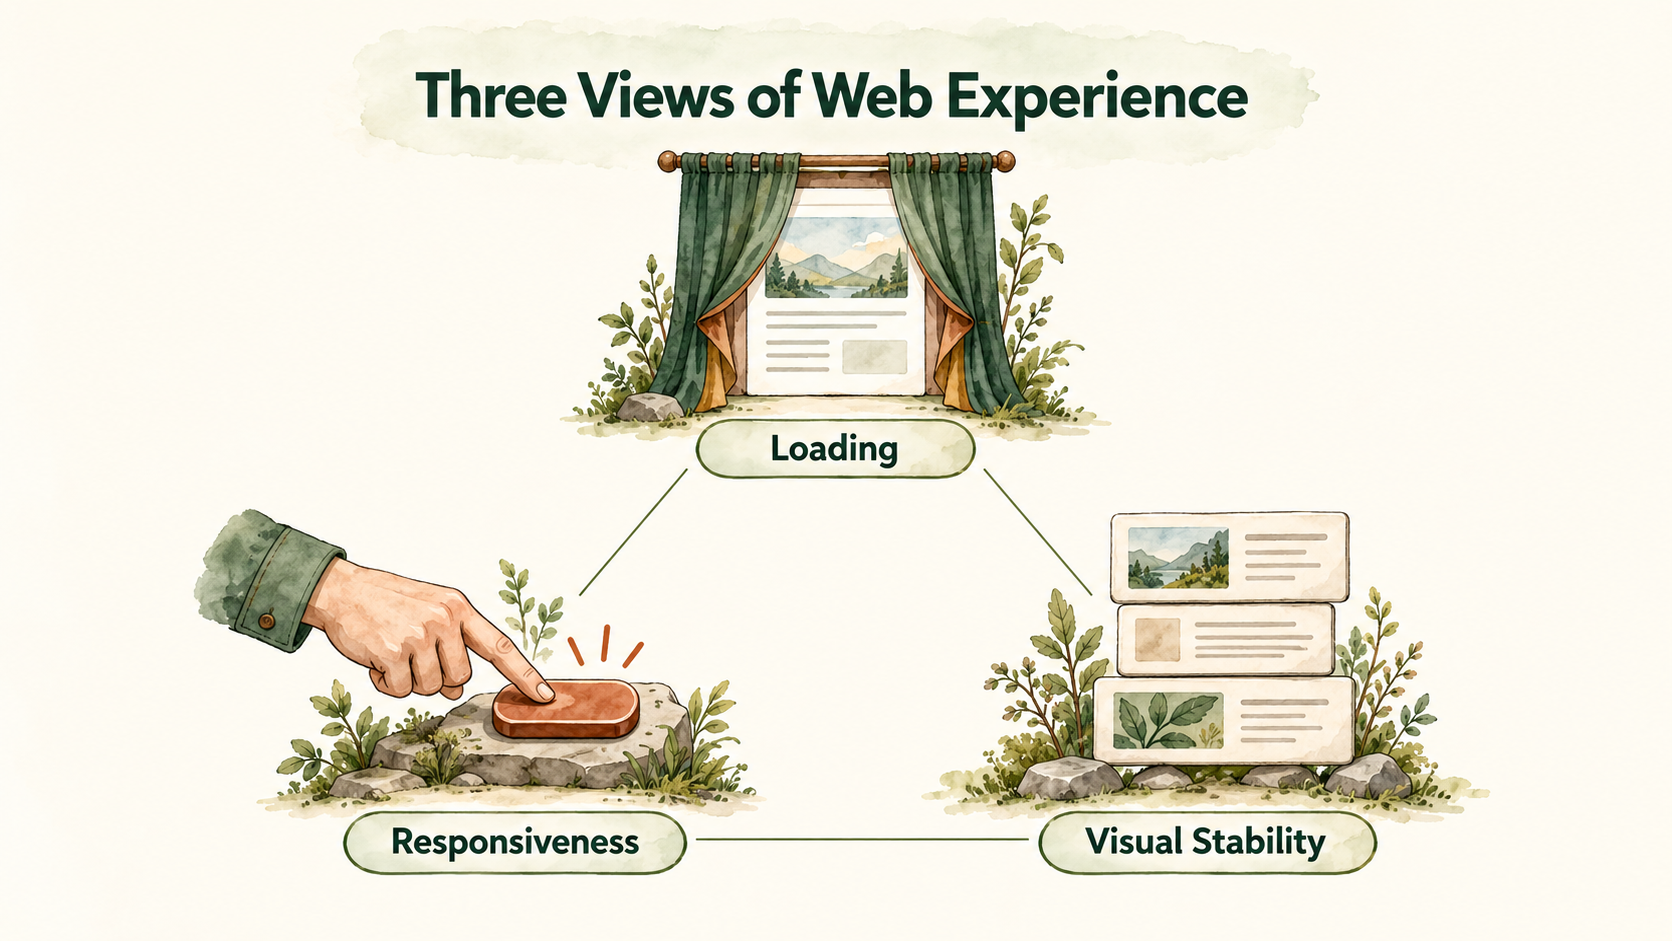
Figure 1: Three complementary dimensions of experience require separate metrics and diagnostic evidence.
3. Use Supporting Metrics to Diagnose Loading Speed
TTFB and FCP Help Locate the Wait
Time to First Byte (TTFB) measures the wait before the first byte of a response is received. It helps investigate the initial response stage; it does not measure when the entire page has finished loading.
First Contentful Paint (FCP) measures when content such as text or an image first appears. A fast FCP with a slow LCP means that something is visible, but visitors may still be waiting for the main content.
Understand these timings along the same loading path, without treating them as independent steps whose durations can simply be added. Much of the work overlaps and can be affected by caching, networks, and rendering decisions.
TBT and Resource Records Provide Diagnostic Clues
Total Blocking Time (TBT) is a common lab metric that measures how long tasks affect responsiveness during loading. It can reveal code overhead, but it cannot directly replace INP measured during real interactions.
Download size, request counts, resource waterfalls, and execution traces also help identify causes. Examine whether a resource is necessary, when it loads, and whether it blocks important content. Fewer requests are not automatically better.
For pages with videos, galleries, or substantial interactivity, preserve the necessary experience while adjusting resource delivery. Removing important information for a better score may not help customers complete their tasks.
4. Interpret Lab and Field Test Results
Use Lab Tests to Compare Changes
Lab data comes from controlled conditions, making it easier to reproduce issues and compare versions. Hold devices, networks, regions, and cache states constant, then observe whether a change affects the relevant metric.
Run the same page several times and retain typical performance and its variation. Do not present only the best run as the result, or compare two report screenshots directly when test conditions differ.
A typical load-based test may not follow the customer’s interaction path. If the issue occurs after using a filter, add interaction testing rather than repeatedly reloading the page and waiting for the problem.
Field Data Captures Real Experience Over Time
PageSpeed Insights can provide both lab and field data. Field data uses samples from the Chrome User Experience Report and commonly covers the preceding 28 days across varied visitor conditions.
After deployment, lab results may change first while the rolling field-data window still includes earlier visits. Record deployment time separately from the data window so you do not conclude immediately that the new version failed.
Check whether the data describes a specific URL or the origin as a whole. If the tool falls back to a broader dataset, it is not direct evidence for that URL. An insufficient sample does not mean that the site has passed.
The 75th Percentile Is Not an Average
Core Web Vitals are commonly assessed at the 75th percentile, meaning that approximately three-quarters of observations achieve that value or better. This helps expose poorer experiences hidden by an average, but it does not replace the full distribution.
Keep mobile and desktop segments visible, and examine regions and page types when needed. Even if the site looks healthy overall, slower mobile visits in a key market may still warrant improvement.
5. Turn Measurements into Improvement Priorities
Consider Business Impact, Affected Visits, and Evidence Together
First establish whether the problem disrupts an important task, such as checking specifications, signing in, or making an inquiry. Then assess the affected page types and visits, whether the issue can be reproduced, and the evidence supporting its cause.
A shared template defect can affect many product pages and make a fix particularly valuable. A small number of campaign pages may also carry important traffic for a limited period. Priorities must reflect business plans, not just URL counts.
Investigate issues with limited evidence before committing to a fix. When the cause is established, estimate the correction, regression testing, and deployment work. Do not turn an assumption into a delivery commitment.

Figure 2: Prioritize website performance issues by their impact, scope, and supporting evidence.
Include dependencies and change risks in the backlog. If a shared component affects several language versions, allow for regression testing of representative samples. If an external service causes the problem, plan vendor coordination explicitly rather than assigning all the work to website editors.
Use a Hypothetical Scenario to Explain the Analysis
Suppose an industrial equipment supplier’s product pages load slowly on mobile, and visitors report pauses when switching specifications. This is a hypothetical scenario, not an actual customer result. The team needs separate evidence for loading and interaction performance.
If tests show that the wait for main content and long interaction tasks have different causes, schedule separate fixes. Compressing images alone does not establish that the specification-switching issue has also been resolved.
Acceptance testing can track LCP for representative page types, relevant interaction delays, functional success rates, and form completion. Traffic and content also affect business figures, so document comparison conditions instead of attributing every change to speed.
6. Retain the Evidence Needed for Reporting and Acceptance
Build Before-and-After Comparisons Under Consistent Conditions
Reports should list URLs, versions, devices, networks, regions, test dates, and reporting periods. Separate first-time visits from cached visits, and record sign-in status, consent choices, and the state of third-party tools.
Link each change to its expected effect. After adjusting a main image, inspect the relevant loading path. After splitting interaction work, retest that action. A change in the overall score alone rarely proves that the underlying cause has been addressed.
After deployment, verify that production content and settings match the test conditions. If a cache still serves an older version, or an external service behaves differently at different times, resolve that uncertainty before interpreting the results.
Validate Functionality Alongside Performance
Faster performance must not come at the expense of working features. Assign appropriate owners to check form submissions, error messages, downloads, language switching, and tracking events, particularly after changing code loading order.
Create a short acceptance checklist that can be reused for every deployment:
- Representative page types and important interactions are in scope.
- Before-and-after versions use comparable test conditions.
- Each metric and its reporting period are documented.
- Evidence supports the diagnosed causes.
- Features, forms, and required events work correctly.
- Unresolved issues and follow-up owners are identified.
7. Monitor Performance Without Chasing Scores
Build baselines and monitoring ownership into routine website updates. When adding images, videos, marketing tags, or code releases, check representative pages for regressions and retain records tied to the change dates.
Set monitoring targets for important page types rather than applying the same resource limits to every page. The aim is to recognize problems and identify who investigates next, not to generate alerts that nobody handles.
When a value changes suddenly, review the visitor mix, test conditions, and version before deciding whether a fix is needed. Changes in the proportions of regions or devices can affect overall results.
A monitoring dashboard can offer an executive summary and a separate diagnostic layer. The summary should explain affected tasks, current status, and next steps; the details should retain samples, test settings, and versions so decision-makers and practitioners can find what they need.
For pages near a threshold, examine sustained performance and variation rather than treating one crossing as a complete conclusion. If an improvement requires removing an important feature, assess alternative designs and business tradeoffs.
Good Core Web Vitals support user experience but do not guarantee search rankings. Continue to provide useful content, a clear structure, and workflows people can complete. Performance is one part of overall website quality.
8. Frequently Asked Questions
Is the overall PageSpeed score enough to assess website performance?
No. An overall score is a useful starting point, but examine individual metrics, test conditions, and important interactions. Scores from different sources serve different purposes. One number is not enough to accept an entire website.
Why can buttons respond slowly even when LCP is good?
Loading and interaction performance describe different experiences. Code may still occupy processing time after the main content appears. Reproduce the button interaction and analyze the work performed during it, rather than simply retesting page loading.
Can optimization begin without field data?
Yes. Establish a controlled test baseline and address reproducible issues while planning suitable real user monitoring. Reports should state what data is available and which conclusions still require more evidence.
9. Conclusion
Website performance metrics help you find where users wait, identify causes, and validate improvements. Understand each metric and its conditions first, then organize the work around business tasks to turn numbers into a better experience.
LeadsTech can discuss your website performance testing and optimization needs, defining the scope through representative page types, diagnosis, and acceptance planning.

To clarify issues in your current reports, bring important URLs, visitor environments, and known interaction scenarios so we can discuss the next steps.

10. Further Reading
-
How CMS Affects SEO: A Website Content Management Optimization Guide
Understand the relationship between content management, website structure, and SEO performance.
-
Choosing an SEO/GEO Consultant or Service Provider: An Evaluation Guide
Explore deliverables, validation methods, and engagement scope when evaluating external consultants.
Related Articles

Enterprise AI MarTech Trends Analysis 2024-2029 Outlook Report
From AI content productivity tools to a core engine for revenue growth and marketing transformation
*The PDF will be sent directly to your inbox.